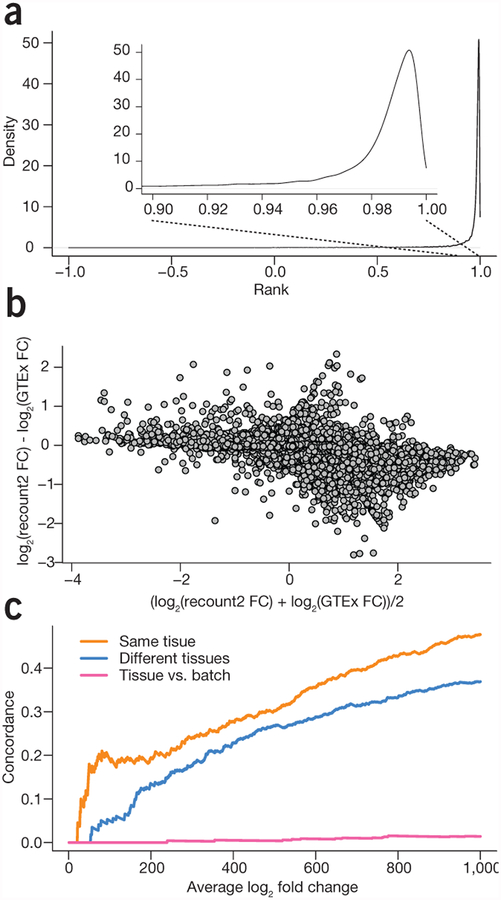
Figure 1.
Meta-analysis and study comparison facilitated by recount2. (a) The distribution of correlations between gene expression estimates for GTEx v6 from the GTEx portal and the counts calculated in recount2 for protein coding genes. The gene expression counts are highly correlated between both quantifications for almost all genes. (b) A comparison of the fold changes for differential expression between colon and whole blood using the quantifications from GTEx and from recount2 for protein coding genes. The majority of genes have a similar fold-change between the two analyses. (c) A concordance versus rank (i.e., ‘concordance at the top’, CAT) plot showing comparisons between a meta-analysis tissue comparison of whole blood and colorectal tissue in data from the sequence read archive and the GTEx project. When comparing the same tissues, there is a strong concordance between differential expression results on public data and GTEx (orange), less concordance when different tissues are compared (blue) and almost none when comparing different analyses (pink).

