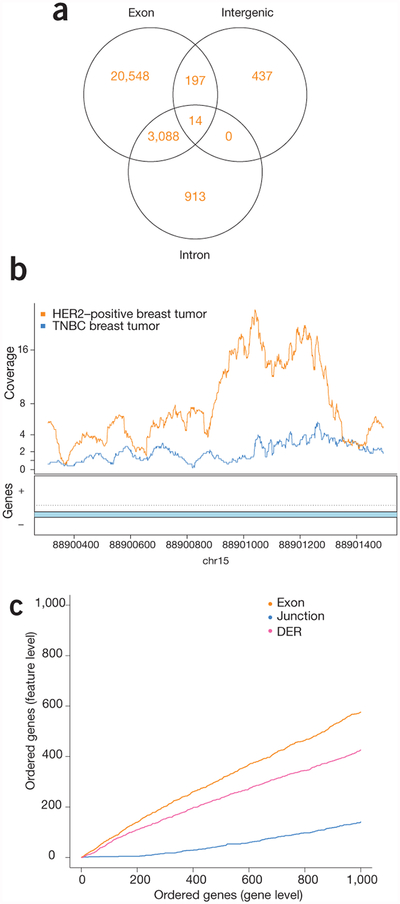
Figure 2.
Multi-feature-level differential expression analysis is facilitated by recount2. (a) Venn diagram showing the number of expressed regions detected that overlap exons, intergenic regions and intronic regions, including expressed regions that overlap multiple annotation types. Differential expression occurs outside of previously annotated protein-coding regions. (b) An example of a region on chromosome 15 showing differential expression between breast cancer subtypes in an annotated intron. The lines show the average coverage in each group across samples. (c) CAT plot of concordance between gene-level analysis and then exon-, junction- and region-level (DER) analyses shows high concordance across the different feature levels.

