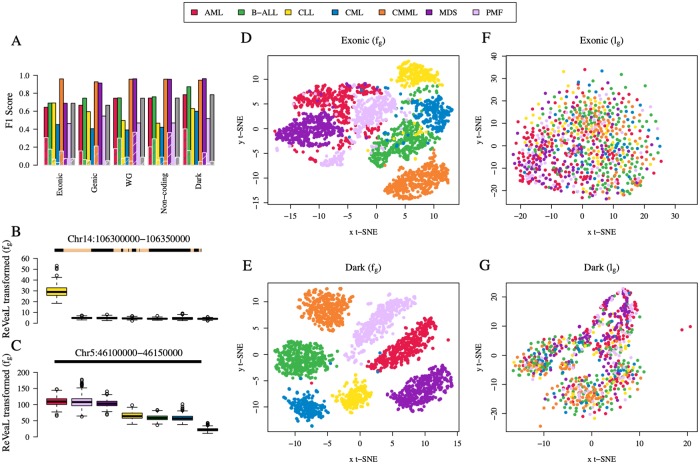
Fig 2. Disease-by-disease ReVeaL Analysis.
(A) F1 scores for genomic sectors for each disease are averaged over all 10 replicate analyses per chromosome and the maximum F1 score is reported for that disease. ReVeaL scores on disease-label permutations are shown in overlaid hatched bars. The gray bar represents the mean over all diseases. (B-C) Boxplot of fg, shingle values representing the four moments of the distribution, of samples per disease and diseases ordered by decreasing median fg for the top 2 ReVeaL features. The line above each boxplot represents the shingle, the yellow interval representing the portion of the segment that is masked. (D-G) t-SNE visualization (perplexity = 40, iterations = 300) using the top 50 shingle fg values (B and C) and mutational load lg, number of mutations for a given window in the genomic region for a given patient, (D and E), respectively, in exonic and dark sectors.

