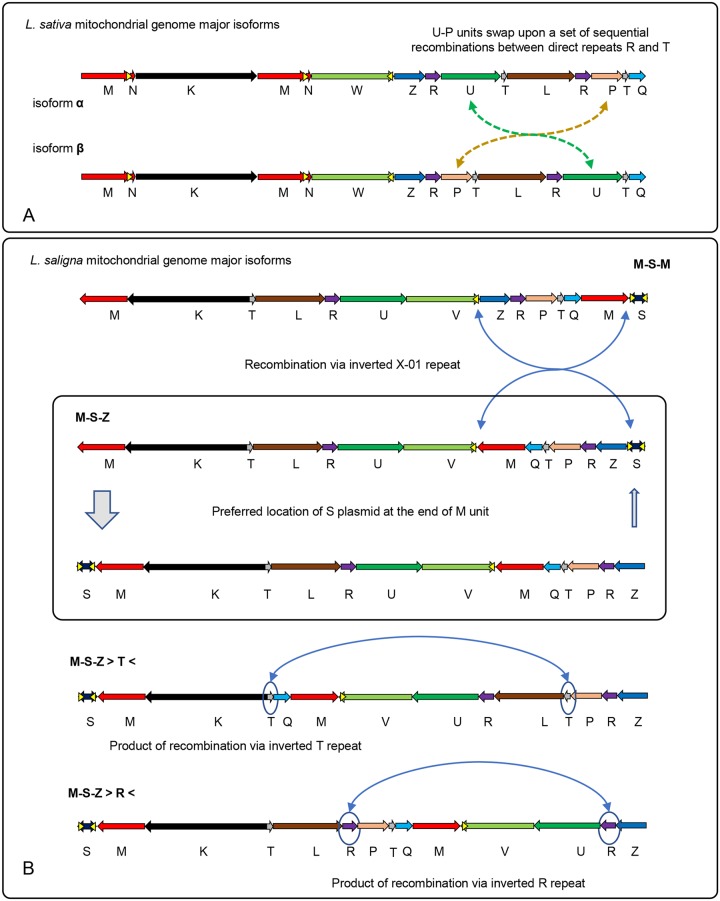
Fig 2. Isoforms of Lactuca mitochondrial genomes.
Putative major isoforms of L. sativa (A) and L. saligna (B) were derived from analysis of secondary building blocks (Fig 1B–1F) and the primary structural unit stoichiometry (Fig 1A and S2 Fig). For L. sativa, the dashed green arrow in A shows rearrangement of unit U and the dashed yellow arrow shows rearrangement of unit P between the two major isoforms. For L. saligna, putative recombination events that result in a transition from one isoform to another are indicated by solid blue arrows. Isoforms are labeled by the configuration of the units M, S, and Z, with > and < symbols designating where recombination has taken place. Yellow triangles indicate repeat X-01. Displayed isoforms are simplified models that fit the sequential order of primary structural units and stoichiometry data and make no assumptions about the underlying form of mtDNA molecules.

