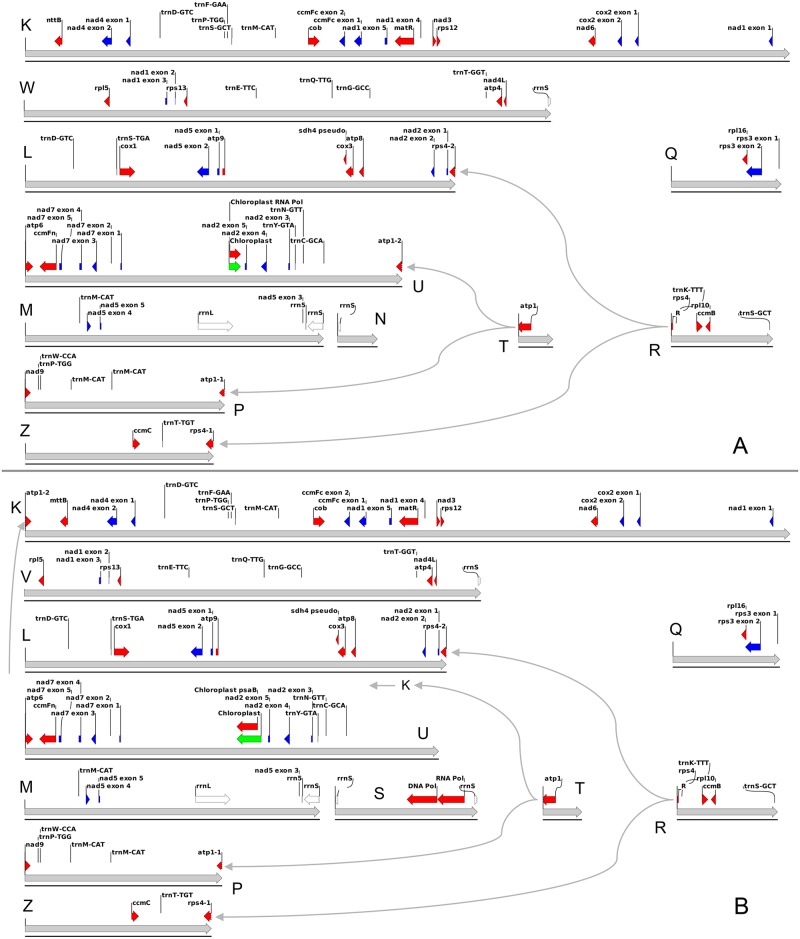
Fig 3. Lactuca mitochondrial genome annotations.
The annotations for genes and other sequence features for L. sativa (A) and L. saligna (B) are displayed along the primary structural units (see Fig 1A) for each genome, which are indicated by thick gray arrows. Intronless genes are indicated by red arrows, exons of spliced genes are indicated by blue arrows, ribosomal RNA genes by white arrows, and plastid insertions are indicated by green arrows. Genes that span junctions between primary units are indicated by a jagged line at the division point. Thin gray arrows show alternative junctions between primary structural units that result in different models for the genes that are split over a junction.

