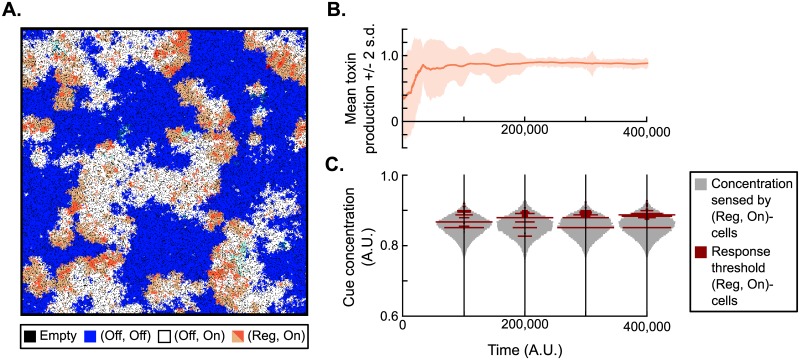
Fig 4. Model dynamics of a run in which density-dependent toxin regulation evolved.
(A) Snapshot of the simulation lattice. KRS-dynamics emerge with sensitive cells (genotype (Off, Off), blue), resistant cells (genotype (Off, On), white) and regulating killer cells (genotype (Reg, On), orange). The latter switch between two phenotypes: toxin producing (dark orange) and resistant (light orange). See also S1 Video. (B) Toxin production rate in the (Reg, On)-cells over time. Cells were initialised with a toxin production rate sampled at random between 0 and 1. Over time, a mean value of πT ≈ 0.8 is selected. (C) Distribution of response threshold values in (Reg, On)-cells over time, plotted against a background distribution of the cue concentration sensed by these (Reg, On)-cells. Response threshold values around θ = 0.875 are selected. The selected response threshold values tend to be higher than the median cue concentration sensed by regulating cells, indicating that at any time only a minority of cells produces toxin.

