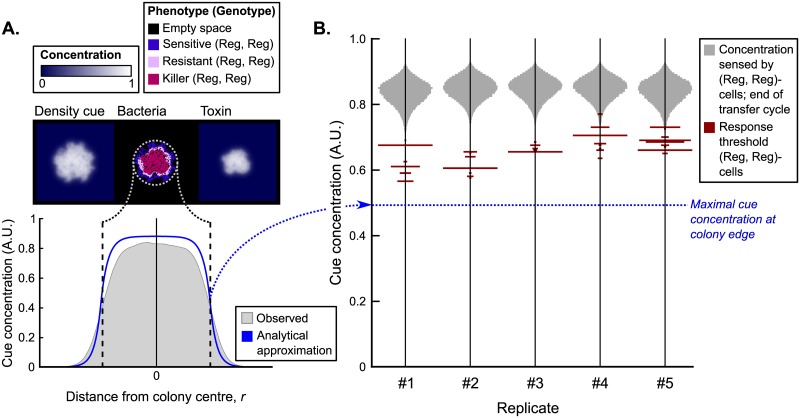
Fig 6. Density cue concentration profile of expanding colonies and the evolved response threshold values of (Reg, Reg)-cells.
(A) Colonies were grown from a single (Reg, Reg)-cell to characterise the radial density cue concentration profile of an expanding colony. Measured values from the simulations correspond well to the analytical approximation (see S2 Text). (B) Distribution of the evolved response threshold values in (Reg, Reg)-cells at the end of the simulation (time = 600, 000), plotted against the background of the cue concentration sensed by these cells at the end of a transfer cycle (i.e. when the population approaches carrying capacity) for five replicate simulations. The evolved response threshold values vary somewhat between replicates, but are always lower than the cue concentration at local carrying capacity (grey distributions) and higher than the maximum of the cue concentration at the edge of a growing colony. Hence, cells on the colony edge never express their toxin production and resistance genes, while cells in the colony interior and at the interface between colonies (where local cell density is close to carrying capacity) are resistant and do produce toxin.

