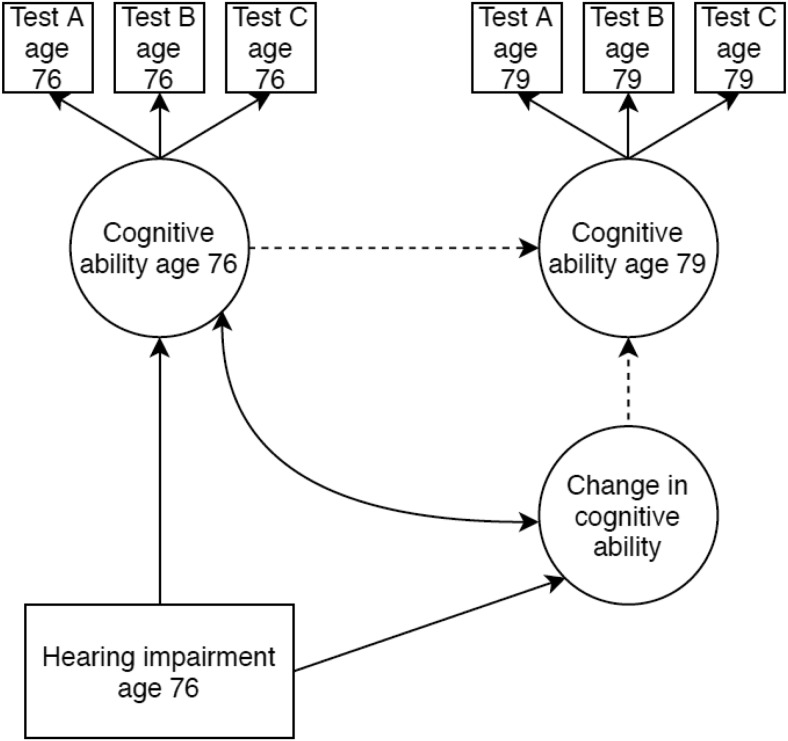
Figure 2.
Simplified path diagram of the latent difference score model testing for associations between hearing ability at age 76 and level or change in cognitive ability. Ellipses represent latent variables, rectangles observed variables, double headed arrows correlations, and single headed arrows regression paths. Dotted lines indicate paths fixed to 1 for identification purposes. Only the first three cognitive ability tests are shown; however, 13 tests served as indicators of general cognitive ability at each wave. Also not shown, are correlations between measurement residuals of the cognitive ability tests. Measurement residuals of groups of tests from the same cognitive ability domain were allowed to correlate within and between waves (as described in the Method section).

