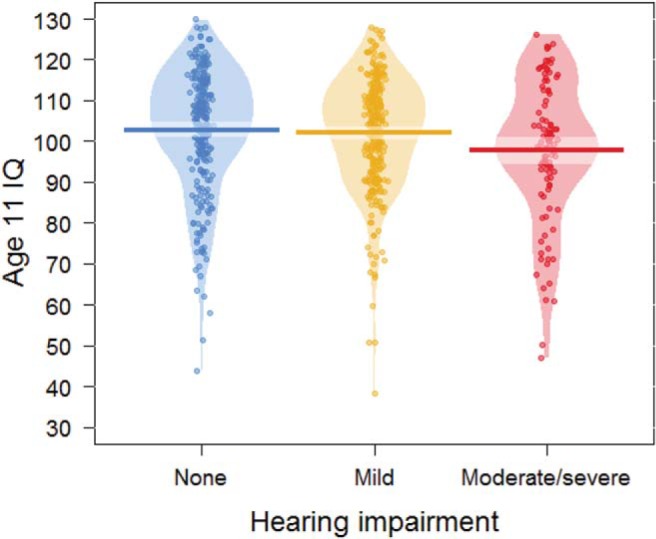
Figure 4.

Plot of age 11 IQ by category of hearing impairment at age 76. Bars indicate mean scores; the lighter bands represent Bayesian highest density intervals. The “bean” shapes are smoothed density curves that show the full distribution of the data.
