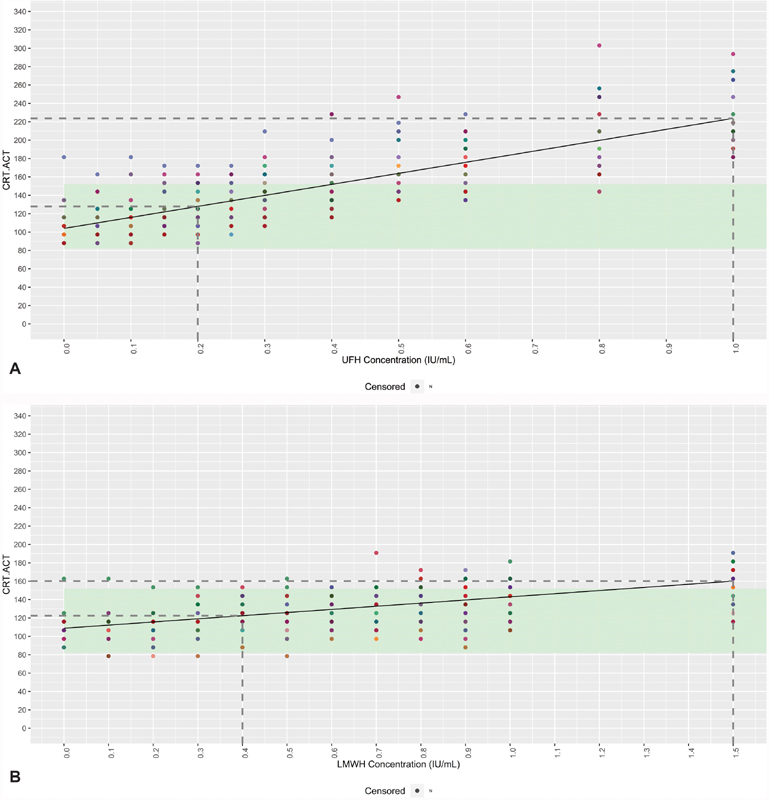
Fig. 3.

Linear mixed-effects model of CRT.ACT or CFF.MA in relation to the UFH ( A ) or LMWH ( B ) concentration. Individual donors are highlighted in different colors, with the model ( black line ) included. Reference range limits are shown in light green . The dotted lines represent the minimum and maximum values (first dose where the response was statistically significant from the dose 0 response or last dose where the response was statistically different from the last observed dose in the model, respectively). Values greater than 60 are beyond the limit of detection, and so are marked as censored. ACT, activated clotting time; CFF, citrated functional fibrinogen; CRT, RapidTEG; LMWH, low-molecular-weight heparin; MA, maximum amplitude; UFH, unfractionated heparin.
