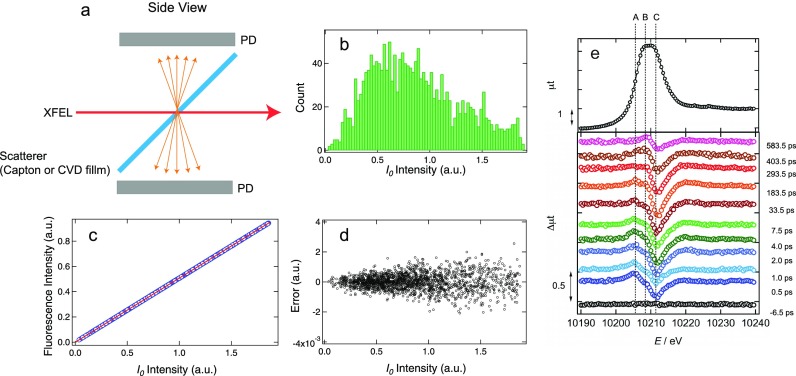
FIG. 3.
X-ray intensity monitor for TR-XAS. (a) Schematics of the I0 intensity monitor. (b) Monochromatic XFEL intensity fluctuation at 8.985 keV obtained using ∼1800 shots. (c) Correlation of the fluorescence intensity with respect to incoming monochromatic intensity for the same shots with (b). The used sample is a [CuI(dmphen)2]+ (dmphen = 2,9-dimethyl-1,10-phenanthroline) dissolved in acetonitrile with a concentration of 100 mM. The solution was flowed as a liquid jet through the injector with an inner diameter of 50 μm. The blue circles and red line correspond to the experimental data and the linear fitting, respectively. (d) The residual error after the linear fitting of (c). (e) W LIII TR-XAS spectra. (Reproduced with permission from Uemura et al. “Dynamics of photoelectrons and structural changes of tungsten trioxide observed by femtosecond transient XAFS,” Angew. Chem., Int. Ed. 55, 1364–1367 (2016). Copyright 2016 Wiley-VCH Verlag GmbH & Co. KGaA.) The sample was the water suspension of WO3 nanoparticles with a concentration of 4 mM, which was flowed through the injector with a diameter of 500 μm.

