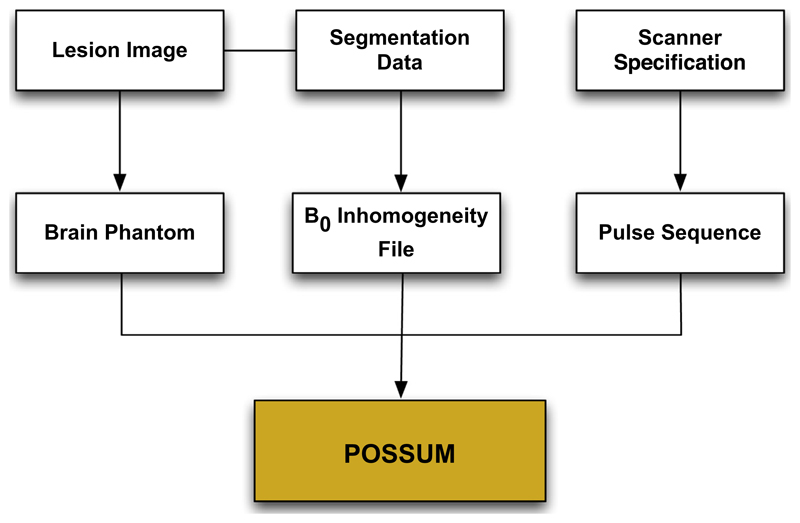
Fig. 4.
The various inputs to POSSUM to simulate the MRI phase images. Lesions are manually drawn in the input phantom image. The B0 inhomogeneity file describes change in magnetic field strength inside the cranium due to tissue susceptibility differences. To calculate these distortions, Maxwell’s equations are solved at each voxel in an air-tissue segmentation volume using the perturbation method. Finally, the MRI pulse sequence (eg. EPI) characteristics can be specified for each simulation.

