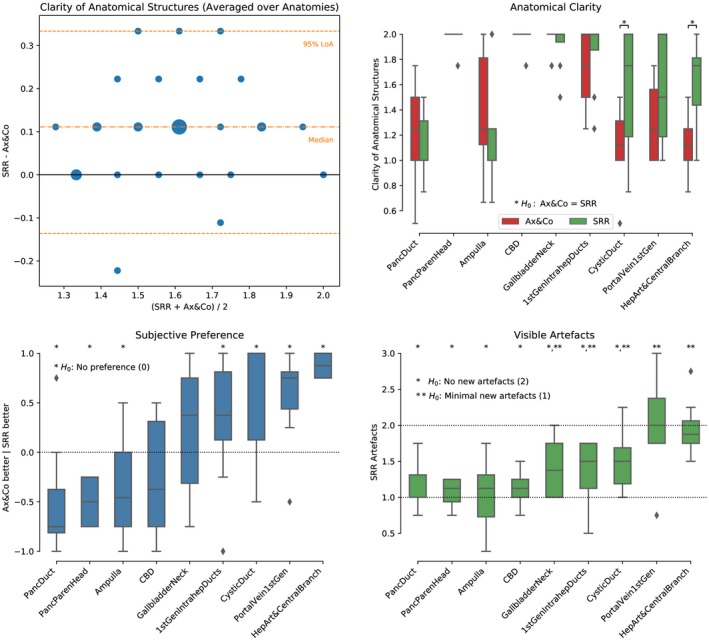
Figure 7.

Clinical evaluation by four radiologists for the abdomen of the third experiment for all eight subjects. Top panels: Clinical interpretability scores were 0 (structure not identified), 1 (structure poorly visualized), and 2 (structure clearly visualized). Bottom left: Subjective impression score ranks how frequently the SRR (NiftyMIC a+c+s+3obl) was considered subjectively of worse, same or better quality than the original axial and coronal SST2W data for interpretation. Bottom right: Artifacts measure to what extent the SRR presented additional artifacts with respect to the original axial and coronal SST2W data with scores 0 (lots of new artifacts), 1 (minimal new artifacts), 2 (no new artifact), and 3 (less artifact than original). Stars are shown to illustrate significant outcomes by rejecting the respective hypothesis based on a Wilcoxon signed‐rank test (p < 0.05)
