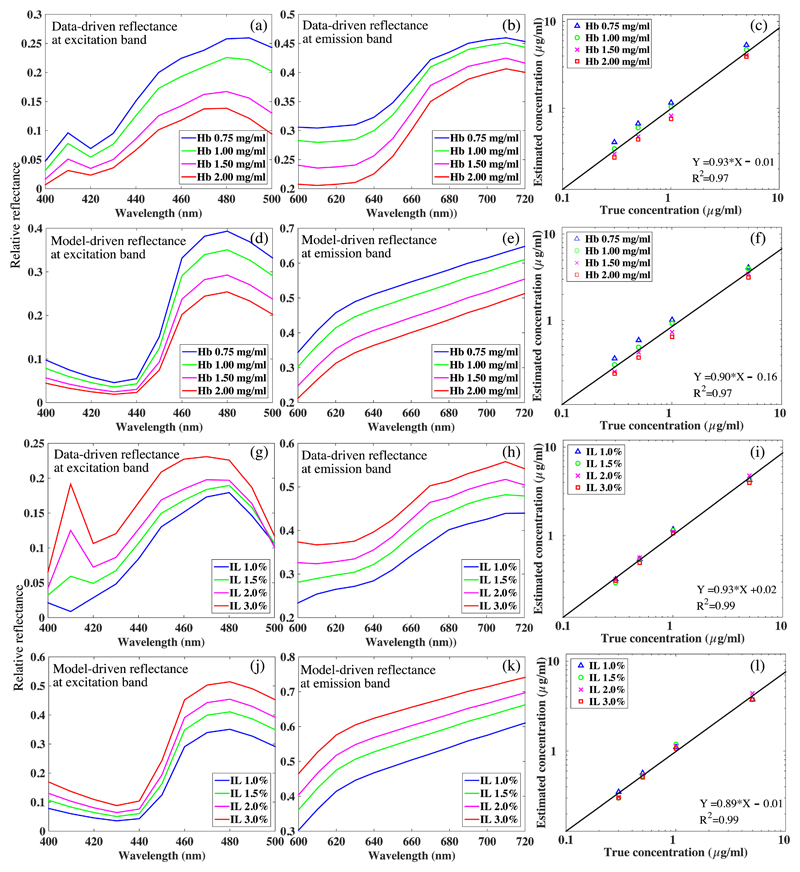
Fig. 11.
(a, b, d, e, g, h, j, k) The data-driven diffuse reflectance at both the excitation band and the emission band well correspond to the model-driven diffuse reflectance. Accordingly, (c, f, i, l) the PpIX concentrations reconstructed with the measured diffuse reflectance are consistent with the ones determined with the modeled diffuse reflectance, featuring a comparable coefficient of determination of the linear fits.

