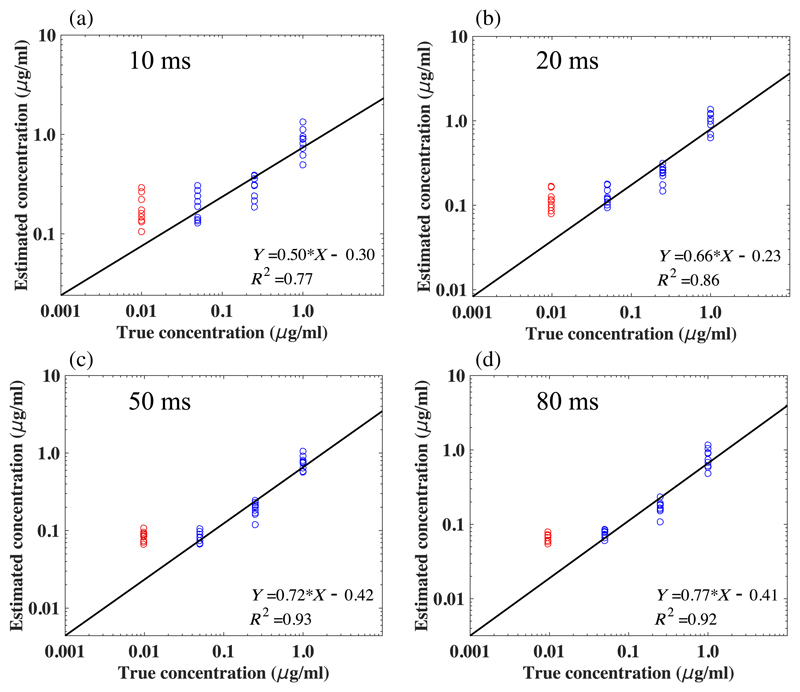
Fig. 5.
Retrieved quantitative PpIX concentrations against the ground-truth PpIX concentration of nine sets of tissue-mimicking optical phantoms under four different camera exposure times of (a) 10, (b) 20, (c) 50, and (d) 80 ms. Linear fit is performed from PpIX concentration range from 0.05 to 1.00 μg/ml for each plot. Lowest concentration of 0.01 μg/ml is indicated in red as the linearity is broken down in each plot.

