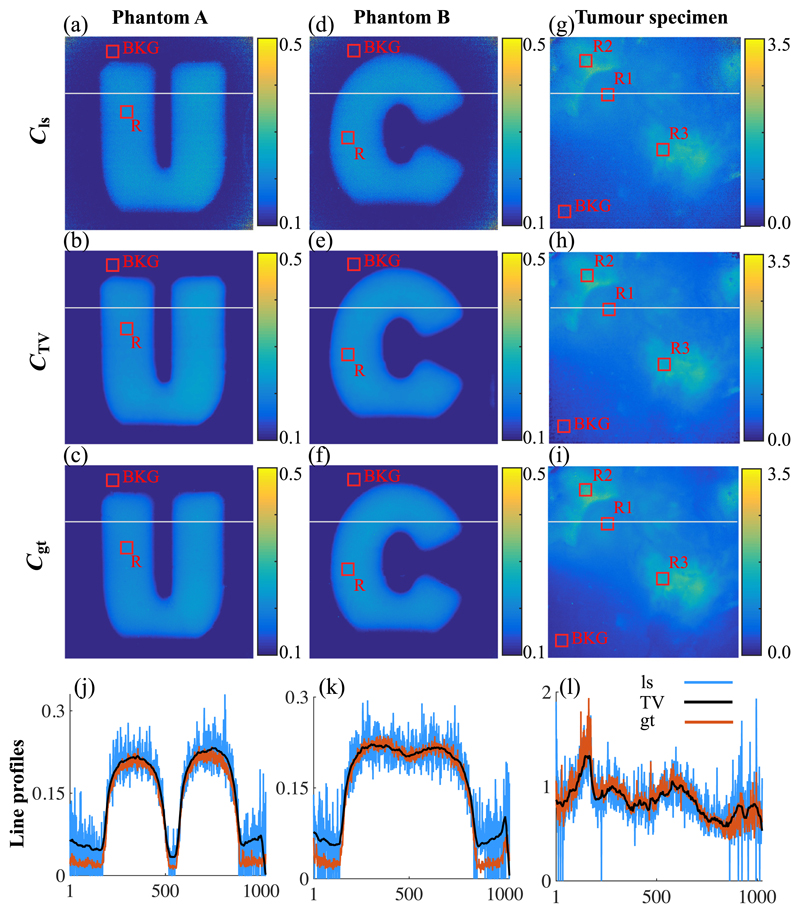
Fig. 6.
The (b, e, h) results of applying TV regularization/denoising to (a, d, g) noise-contaminated images obtained using low exposure time of 20 ms. Ground-truth images are computed using higher exposure times, (c, f) 200 ms for phantoms and (i) 100 ms for tumor specimen. For each image, noise is reduced/smoothed, edge feature is preserved, and intensity level is retained. Background region (BKG) and regions of interest (R) for each image are denoted in red box. (j, k, l) Intensity profiles of each image demonstrate that TV regularization removes noise, while the edge features and the intensity level/PpIX concentration value are well preserved. Intensity profile is taken from a straight line marked in gray across image’s x-axis. ls, least-squares; TV, TV-regularized; and gt, ground truth.

