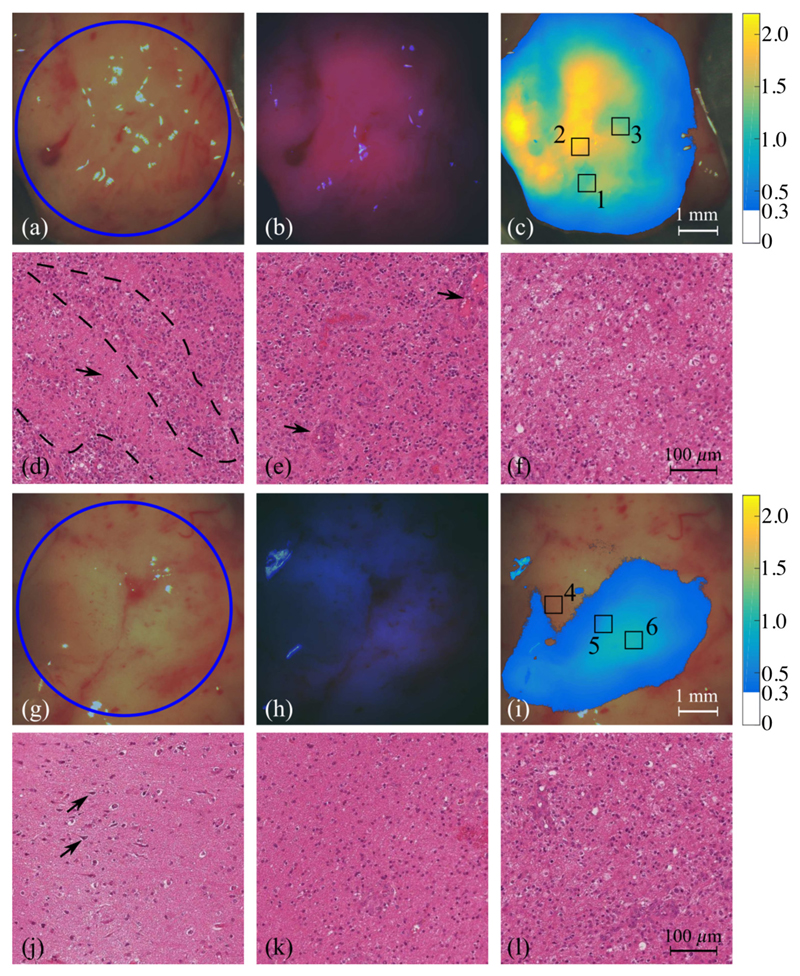
Fig. 8.
White-light RGB images of two representative tissue areas with blue circles indicating the UV-illuminated area, one of which includes (a) compact tumor tissue, and (g) a combination of infiltration margin and relatively healthy cortical tissue. (b, h) Corresponding fluorescence images demonstrating PpIX fluorescence at λ = 640 nm. (c, i) Map of the estimation of concentration of PpIX displaying CPpIX > 0.3 μg/ml. (d, e, f) Microscopic images of H&E-stained slides, respectively, corresponding to regions of interest 1, 2, and 3 in (c) reveal different typical characteristics of glioblastoma. (j, k, l) Histopathology images of ROI 4, 5, and 6 in (i) display a diffusive proliferation of tumor cells from the margin (k, l) into the relatively healthy tissue (j).

