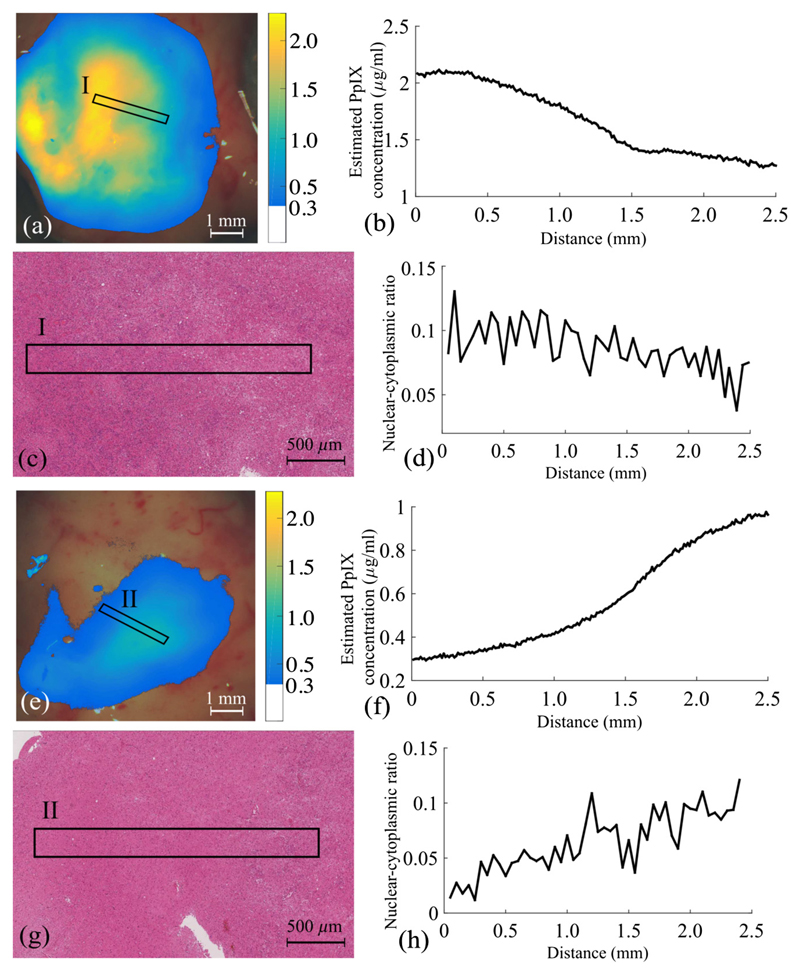
Fig. 9.
Two ROIs where the quantitative measures in regards to PpIX concentration and cellular density are shown. ROI I and ROI II are indicated in (a, e) the superimposed CPpIX maps and in (c, g) the corresponding histology picture, respectively. The CPpIX profiles are plotted against the region distance in (b, f), while the NC ratio are presented in (d, h).

