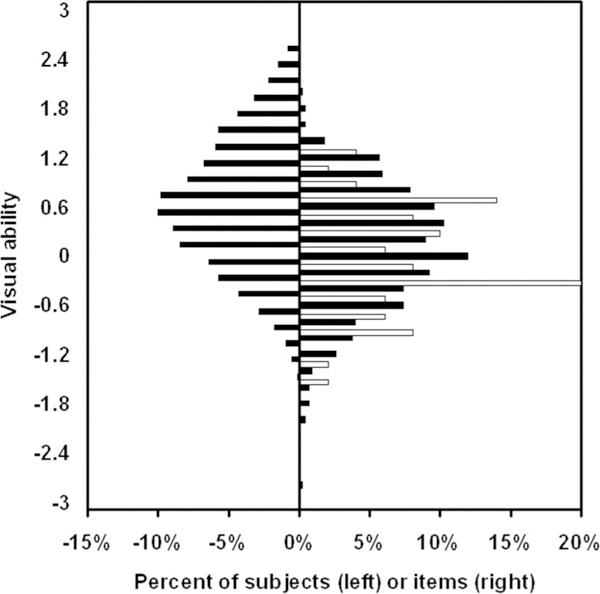
FIGURE 1.

Person-item map that illustrates the relationship between the distribution of person measures (visual ability histogram on the left) and the distribution of item measures (required visual ability histogram on the right). For the item measures, the white bars on the right represent the relative distribution of required visual ability among the 50 Goals and the black bars on the right represent the relative distribution of required visual ability among the 459 Tasks.
