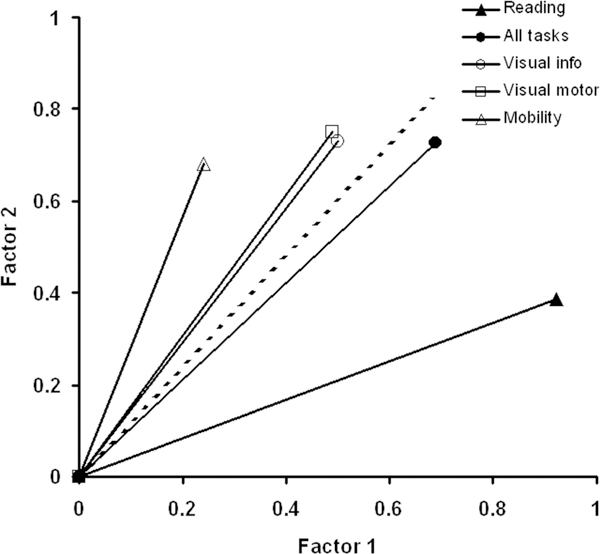
FIGURE 4.

Factor plot for person measures estimated from responses to Tasks in representing different visual functions: reading (solid triangle), visual motor(open square), visual information (open circle), mobility (open triangle), and all Tasks combined for visual ability (filled circles). The cosine of the angle between any pair of vectors corresponds to the partial correlation between those measures when all but these two factors are fixed. The dashed line represents the location of the first principal component.
