Figure 2.

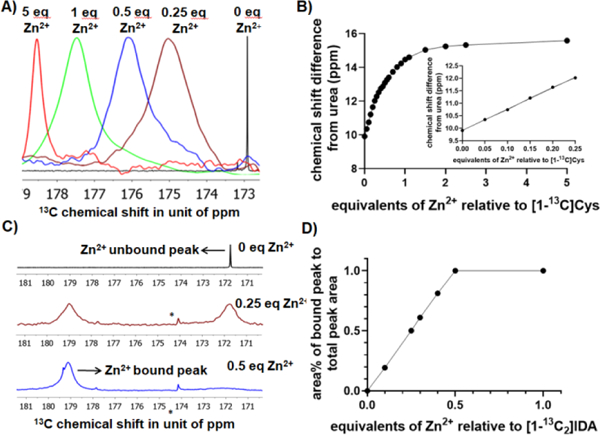
Response of [1-13C]Cys and [1-13C2]IDA to Zn2+ can be detected by several magnetic resonance mechanisms. (A) 13C NMR Spectra for 50 mM [1-13C]Cys with varying Zn2+ concentrations (B) Standard titration curve of [1-13C]Cys in response to various Zn2+ concentrations. The insert shows the titration curve at low Zn2+ equivalents. (C) Spectra for 50 mM [1-13C2]IDA with various Zn2+ concentrations highlighting formation of a Zn2+ bound species, and increased linewidth upon Zn2+ binding. * represents natural abundance citric acid peak (D) Standard titration curve of [1-13C2]IDA.
