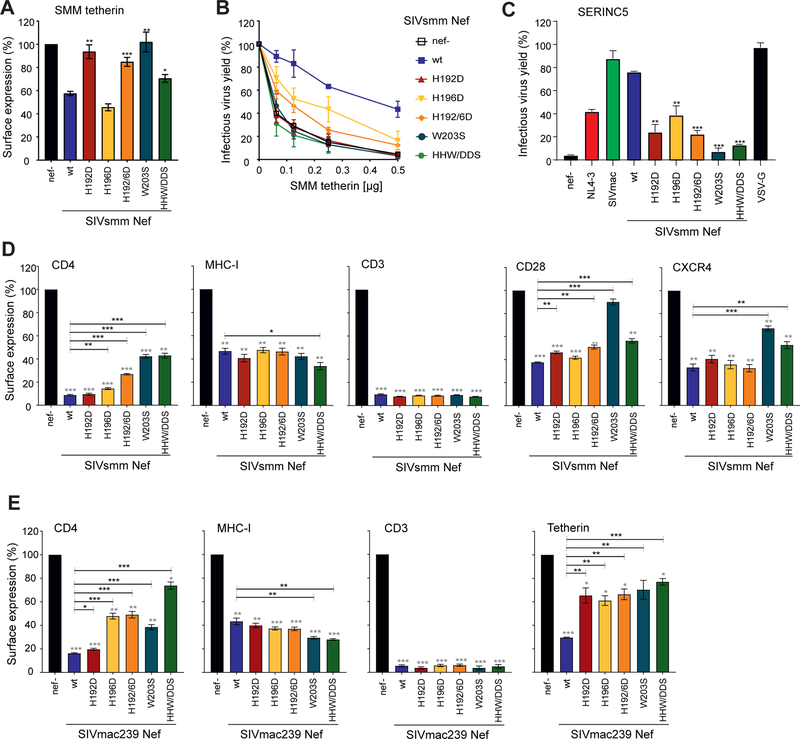
Figure 6. Residue specificity in tetherin antagonism by SIVsmm Nef.
(A, B) Cell surface expression of tetherin (A) and infectious virus yield (B) from HEK293T cells following cotransfection with an env- and vpu-deficient HIV-1 NL4–3 proviral construct encoding the indicated nef alleles and eGFP via an IRES and varying amounts of plasmids expressing SMM tetherin. (A) To measure tetherin modulation, cells were stained with an APC-conjugated antibody against tetherin (Biolegend, 348410) or an isotype control (mouse IgG1-κ, Biolegend, 400121). Tetherin surface expression was analyzed by flow cytometry and the APC mean fluorescence intensity (MFI) of cells coexpressing Nef and eGFP was normalized to the negative control (nef-; 100%). Mean of three to six independent experiments ± SEM. (B) Infectious virus yield was determined by infection of TZM-bl indicator cells and normalized to that detected in the absence of tetherin (100%). Mean of three to six independent experiments measured in triplicates ± SEM. (C) HEK293T cells were co-transfected with vpu- and env-defective HIV-1 NL4–3 constructs encoding the indicated Nef proteins, a construct expressing the HIV-1 Env glycoprotein, and SERINC5 expression or empty control plasmids. Shown are the mean levels of infectious virus production in the presence of transient SERINC5 expression relative to those obtained in cells transfected with the control vector (100%). Mean of three to six independent experiments measured in triplicates ± SEM. (D) To measure receptor modulation, human PBMCs were transduced with VSV-G pseudoytped env- and vpu-deficient HIV-1 NL4–3 IRES-eGFP constructs containing the indicated nef alleles. Cell surface expression of infected (i.e. eGFP positive) cells was normalized to uninfected (i.e. eGFP negative) cells within the same sample before normalization to the negative control (nef-, 100%). Mean of three independent experiments ± SEM. P-values represent differences from the nef-defective (grey stars) or wt SIVsmm (black stars) controls. (E) Rhesus PBMCs were transduced with VSV-G pseudoytped SIVmac239 IRES-eGFP constructs containing the indicated nef alleles. Modulation of CD4, MHC-I, CD3 and tetherin was quantified as described in the legend to figure 6D. Shown are mean values (± SEM) obtained for PBMCs derived from three different rhesus macaques. P-values represent differences from the nef-defective (grey stars) or wt SIVsmm (black stars) controls. *, p < 0.05; **, p < 0.01; ***, p < 0.001. See also Figure S6

