
Fig. 7.
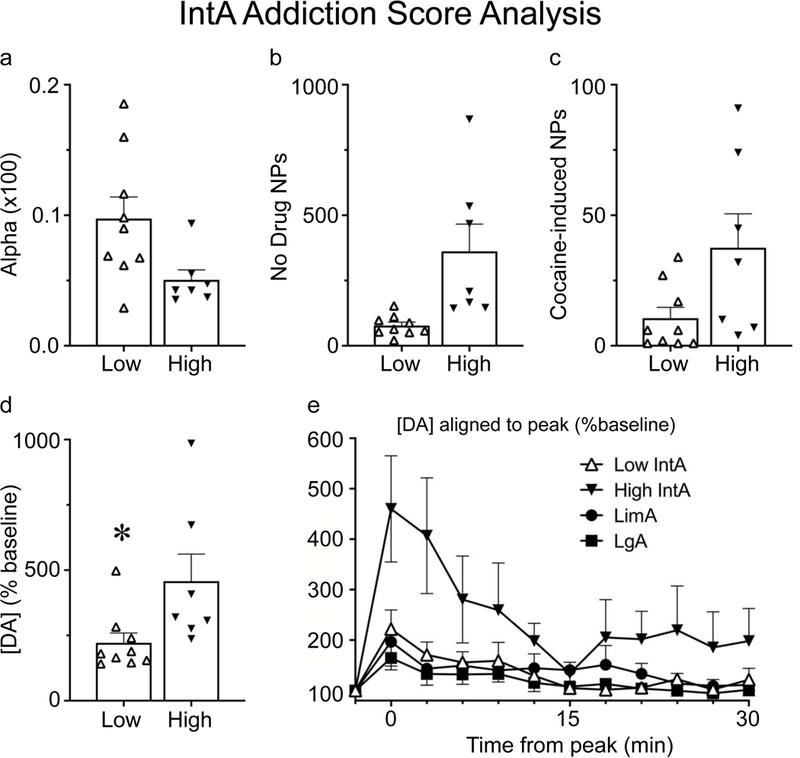
Analysis based on ‘IntA Addiction Score’. IntA rats were separated based on their ‘Addiction Score’ (see methods). Rats that scored 2/3 points (n=7) were classified as ‘High’ and showed increased motivation relative to rats that scored 0/1 points (n=9), classified as ‘Low’, as indicated by alpha (α) (a), active nose pokes (NPs) made during the No Drug periods of IntA (b), and cocaine-induced active nose pokes (measured during the microdialysis test day) (c). A self-administered infusion of cocaine evoked a greater increase in [DA], shown as a percent of baseline, in ‘High’ rats than ‘Low’ rats (d). Panel e shows the timecourse of [DA] (% baseline) following cocaine in ‘High’ and ‘Low’ IntA rats, LimA rats, and LgA rats. Values represent means ± SEMs, α values shown in (a) are calculated values multiplied by 100, * indicates a significant (p<0.05) difference between groups.