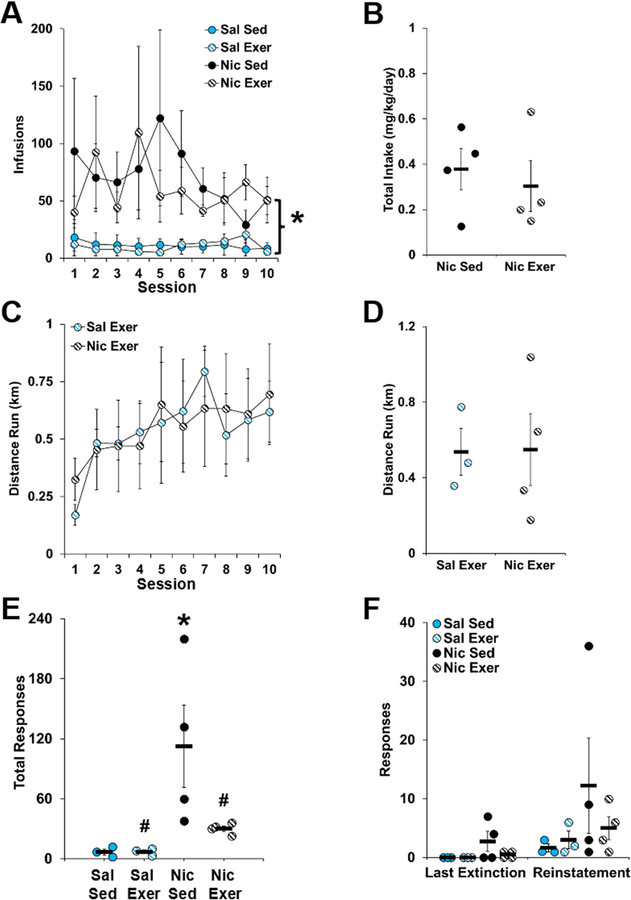
Figure 4.
Behavioral data (mean ± SEM) for extended access self-administration (A and B), distance run during abstinence (C and D), and active-lever responses during extinction (E) and reinstatement testing (F). In panel A, the number of infusions obtained is plotted for each of the groups and for each of the sessions during the 10-day extended access self-administration period. An asterisk indicate a significant difference between the saline and nicotine groups. In panel B, average daily nicotine intake is plotted for each animal in the nicotine sedentary and nicotine exercise groups. In panel C, the daily distance run in kilometers (km) is plotted for each exercise session during the 10-day abstinence period. In panel D, the average daily distance run is plotted for each animal in the saline exercise and nicotine exercise groups. The active-lever responses made during all extinction sessions (Panel E) and during the last extinction session versus the reinstatement test session (Panel F) is plotted for each animal in each of the groups. In panel E, an asterisk indicates a significant difference from the saline sedentary group, and a number signs indicates a significant difference from the nicotine sedentary group. n = 3 (saline, sedentary and exercise) or 4 (nicotine, sedentary and exercise). Exer, exercise; Nic, nicotine; Sal, saline; Sed, sedentary.

