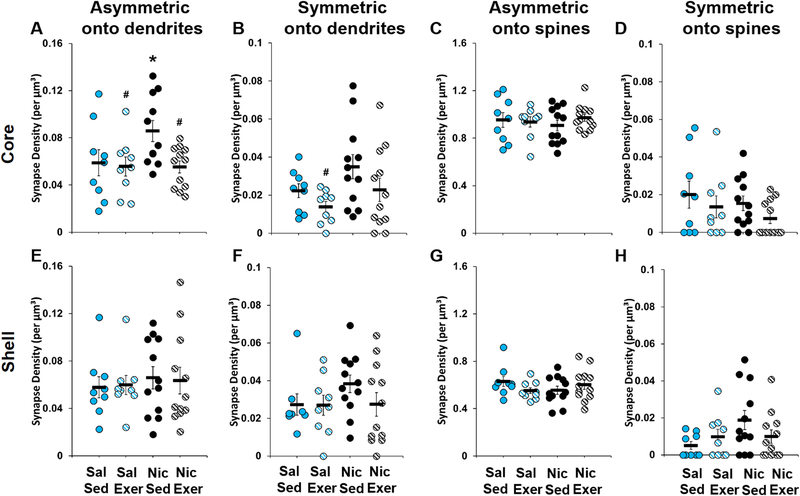
Figure 5.
Volumetric density (mean ± SEM) of asymmetric synapses onto dendrites (A and E), symmetric synapses onto dendrites (B and F), asymmetric synapses onto spines (C and G), and symmetric synapses onto spines (D and H) within the core (A-D) and shell (E-H). Data are based on average densities for each of the three regions within the core and shell for each of the rats in the saline (n = 3) and nicotine (n = 4) groups (data points are shown for each rat for each of the three regions). An asterisk indicates a significant difference from the saline sedentary group (Panel A), and a number signs indicates a significant difference from the nicotine sedentary group (Panels A and B). Exer, exercise; Nic, nicotine; Sal, saline; Sed, sedentary.

