Abstract
Enzymes catalyzing CpG methylation in DNA, including DNMT1 and DNMT3A/B, are indispensable for mammalian tissue development and homeostasis1–4. They are also implicated in human developmental disorders and cancers5–8, supporting a critical role of DNA methylation during cell fate specification and maintenance. Recent studies suggest that histone post-translational modifications (PTMs) are involved in specifying patterns of DNMT localization and DNA methylation at promoters and actively transcribed gene bodies9–11. However, mechanisms governing the establishment and maintenance of intergenic DNA methylation remain poorly understood. Germline mutations in DNMT3A define Tatton-Brown-Rahman syndrome (TBRS), a childhood overgrowth disorder that shares clinical features with Sotos syndrome caused by haploinsufficiency of NSD1, a histone methyltransferase catalyzing di-methylation on H3K36 (H3K36me2)8,12,13, pointing to a potential mechanistic link between the two diseases. Here we report that NSD1-mediated H3K36me2 is required for recruitment of DNMT3A and maintenance of DNA methylation at intergenic regions. Genome-wide analysis shows that binding and activity of DNMT3A co-localize with H3K36me2 at non-coding regions of euchromatin. Genetic ablation of NSD1 and its paralogue NSD2 in cells redistributes DNMT3A to H3K36me3-marked gene bodies and reduces intergenic DNA methylation. NSD1 mutant tumors and Sotos patient samples are also associated with intergenic DNA hypomethylation. Accordingly, the PWWP-domain of DNMT3A shows dual recognition of H3K36me2/3 in vitro with a higher binding affinity towards H3K36me2, which is abrogated by TBRS-derived missense mutations. Taken together, our study uncovers a trans-chromatin regulatory pathway that connects aberrant intergenic CpG methylation to human neoplastic and developmental overgrowth.
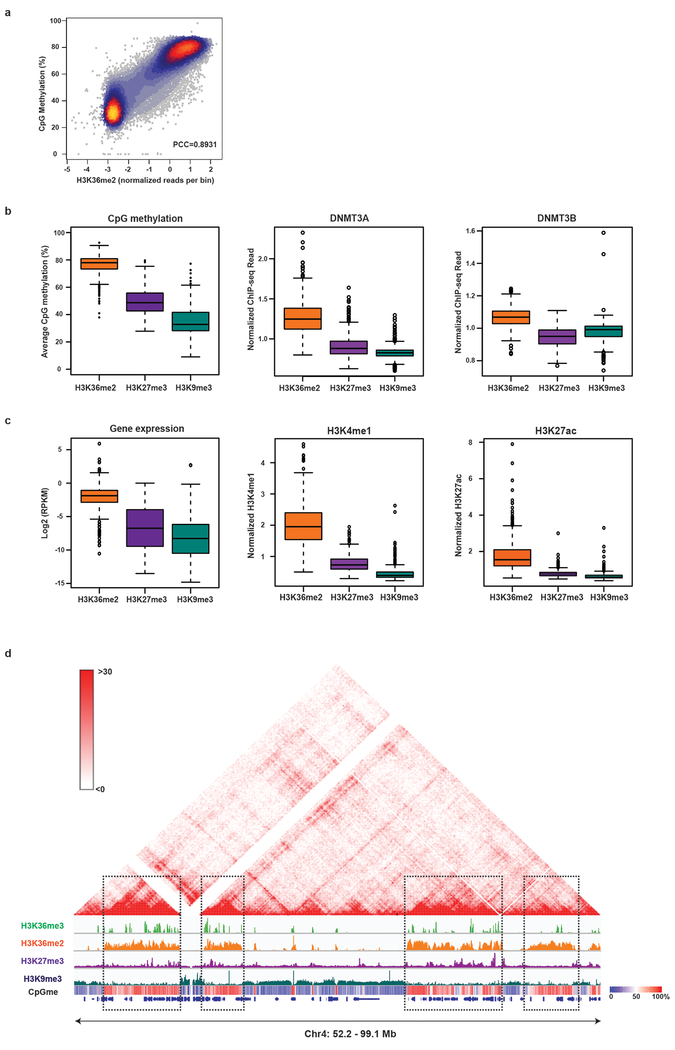
To characterize the role of histone PTMs in regulating DNA methyltransferase (DNMT) targeting and CpG methylation, we profiled the genome-wide distribution patterns of histone PTMs (H3K36me3, H3K36me2, H3K27me3, H3K27ac, H3K9me3, H3K4me1) and DNMT3A/B using ChIP-seq in C3H10T1/2 mouse mesenchymal stem cells (mMSCs). We also measured levels of CpG methylation at base-pair resolution with whole-genome bisulfite sequencing (WGBS) at high coverage (840 million reads; 45x coverage). Enriched regions of H3K36me2 and H3K36me3 were in close proximity and together defined Mb-sized domains that were largely exclusive from domains demarcated by H3K9me3 and H3K27me3 (Fig. 1a). H3K36me2 levels positively correlated with CpG methylation, and together with H3K27me3 and H3K9me3, these histone PTMs partitioned the genome into regions of high (75%), intermediate (50%) and low (30%) levels of CpG methylation, respectively (Fig. 1a, Extended Data Fig. 1a,b). Furthermore, DNMT3A/B ChIP-seq reads were predominantly observed in H3K36me2/3 domains (Fig. 1a, Extended Data Fig. 1b), suggesting that high levels of CpG methylation in these domains are, at least in part, a result of favored DNMT3A/B recruitment. Additional chromatin features associated with H3K36/CpGmehigh domains included higher levels of H3K27ac, H3K4me1 and increased gene expression, consistent with previous reports linking H3K36me2/3 to active gene transcription (Fig. 1b and Extended Data Fig. 1c)14,15. Moreover, H3K36/CpGmehigh domains corresponded to compartments and topologically associated domains (TADs) derived from Hi-C studies of mouse myoblasts16 (Extended Data Fig. 1d), suggesting that these modifications together define transcriptionally active euchromatin that is spatially segregated from constitutive and facultative heterochromatin.
Figure 1: Genome-wide co-localization of DNMT3A, CpG methylation and H3K36me2.
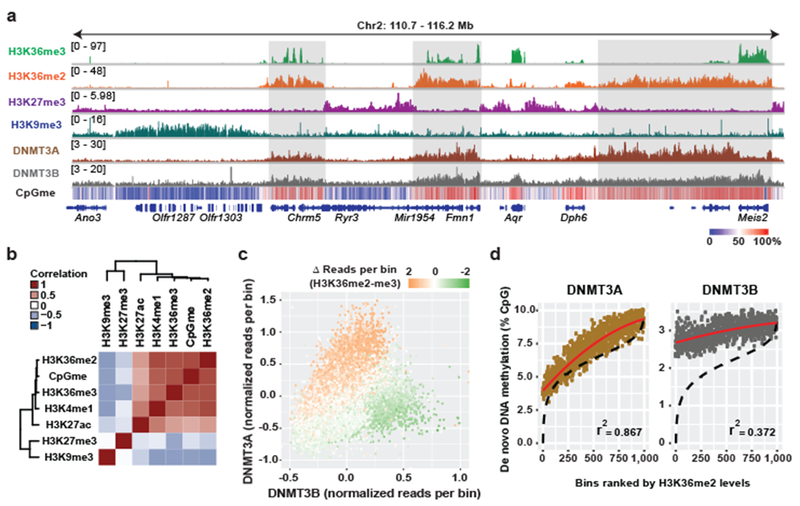
a) Genome browser representation of ChIP-seq normalized reads for H3K36me3, H3K36me2, H3K27me3, H3K9me3, DNMT3A1, and DNMT3B in mMSCs at Chr2: 110.7-116.2 Mb. Levels of CpG methylation are depicted as a heat map (blue/low; white/intermediate; red/high). Refseq genes are annotated at the bottom. For H3K36me3, H3K36me2, and DNMT3A, data are representative of two independent ChIP-seq experiments; for H3K27me3, H3K9me3, and DNMT3B, ChIP-seq was performed once and an independent ChIP was performed in which genomic regions of selective enrichment and depletion were confirmed by qPCR. WGBS was performed once.
b) Heat map showing pairwise Pearson correlation of 10kb bins (n = 246,285) between H3K36me2/3, H3K27me3, H3K27ac, H3K9me3, H3K4me1 and CpG methylation.
c) ChIP-seq normalized reads per 10kb bin for DNMT3A1 (y-axis) and DNMT3B (x-axis) in mMSCs were plotted (n = 246,285). Each bin/dot was color-coded based on differences between H3K36me3 and H3K36me2 ChIP-seq reads to show selective enrichment for H3K36me2 (orange) or H3K36me3 (green).
d) De novo methylation per bin by DNMT3A2 (brown) or DNMT3B (grey) upon reintroduction into DNMT triple knockout mESCs relative to H3K36me2 (n = 1,000). To generate bins, 1kb genomic tiles (n = 2,462,755) were ranked by H3K36me2 enrichment in mESCs and grouped into 1000 rank-ordered bins (2,463 tiles per group). Dashed line indicates H3K36me2 enrichment per bin. Goodness of fit was computed on a quadratic model (red line).
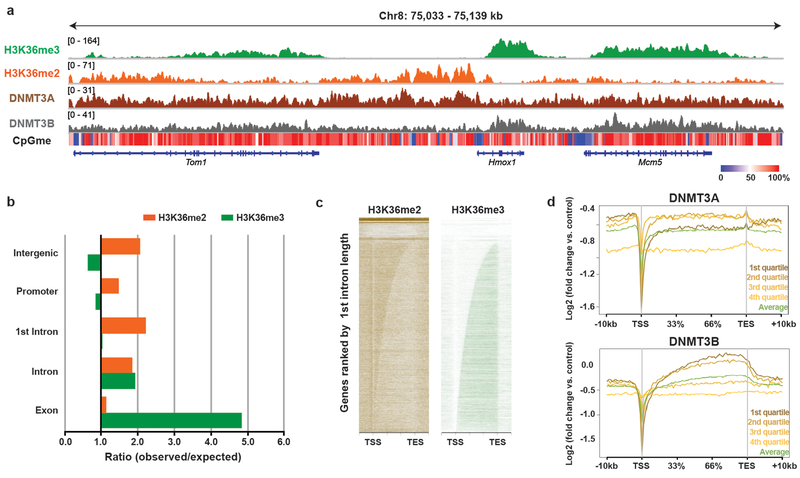
Our observations are consistent with recent reports of H3K36me3-mediated targeting of DNMT3B activity10,11. However, as this interaction is confined to gene bodies, we hypothesized that an additional chromatin trans-regulatory pathway may act in parallel to facilitate CpG methylation at euchromatic regions. Upon closer examination, we observed that while H3K36me3 exhibited characteristic enrichment within gene bodies, H3K36me2 showed a more diffuse distribution that encompassed both genic and intergenic regions (Fig. 1a, Extended Data Fig. 2a,b). Within actively transcribed genes, H3K36me2 covered areas downstream of the TSS through the first intron, followed by a marked switch to H3K36me3 after the first splice junction (Extended Data Fig. 2a–c). Notably, while DNMT3B was enriched within gene bodies containing H3K36me3 (Extended Data Fig. 2d), the localization of DNMT3A mimicked the distribution of H3K36me2 and spanned broad intergenic regions without appreciable levels of H3K36me3 (Fig. 1a, Extended Data Fig. 2a). The discordant targeting profiles of the de novo DNMTs could be reconciled by contrasting the presence of H3K36me2 and H3K36me3 genome-wide. DNMT3A was selectively enriched over DNMT3B at genomic regions with high levels of H3K36me2 compared to H3K36me3 (Fig. 1c).
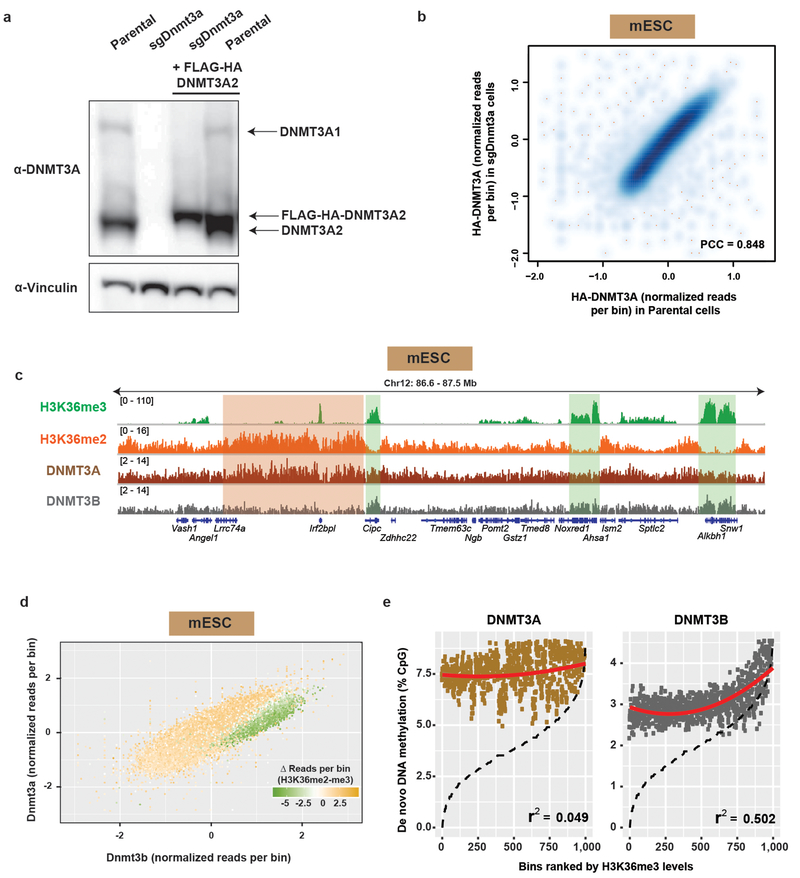
To confirm our findings in another context, we determined whether H3K36me2 played a similarly important role in establishing the genomic methylation landscape in mouse embryonic stem cells (mESCs). We stably expressed hemagglutinin(HA)-tagged DNMT3A2, the predominant DNMT3A isoform, in parental and DNMT3A-deficient (sgDnmt3a) mESCs. When expressed close to physiologic levels, ChIP-seq of HA-tagged DNMT3A revealed similar genome-wide localization patterns between parental and sgDnmt3a cells (Extended Data Fig. 3a,b). When compared with ChIP-seq profiles of H3K36me2/3, the selective co-enrichment between H3K36me2-DNMT3A and H3K36me3-DNMT3B was evident, although in general distribution patterns of DNMT3A and DNMT3B were more positively correlated in mESCs (Extended Data Fig. 3c,d). Importantly, de novo methylation activity of DNMT3A, measured by levels of CpG methylation following the reintroduction of DNMT3A2 into Dnmt1 and Dnmt3a/b triple-knockout mESCs that lack virtually all CpG methylation10, tracked with levels of H3K36me2 (Fig. 1d). This is in contrast to the observation by Baubec et al that de novo activity of DNMT3B correlates with H3K36me310 (replicated in Extended Data Fig. 3e), and suggests that intergenic targeting of DNMT3A and gene-body targeting of DNMT3B together facilitate the establishment of CpG methylation in euchromatin.
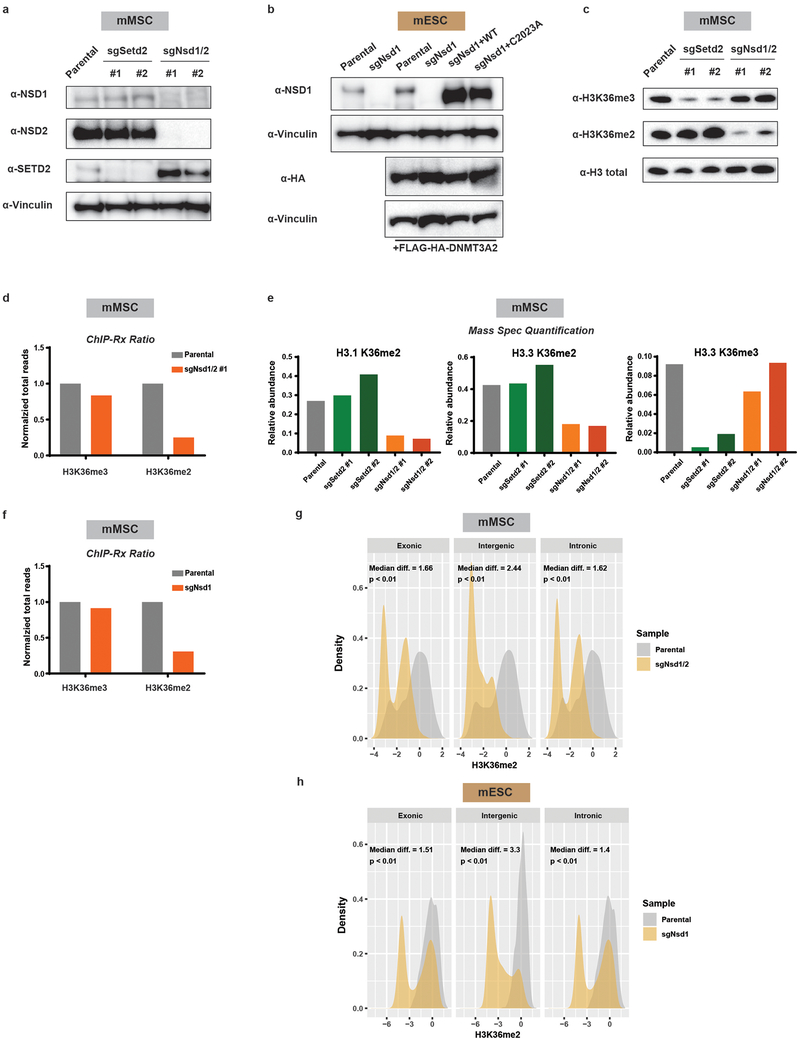
NSD family enzymes have been shown to catalyze H3K36me2 at intergenic regions17. In mESCs, Nsd1 is the major NSD enzyme expressed, while both Nsd1 and Nsd2 are expressed in mMSCs. Therefore, we genetically ablated both Nsd1 and Nsd2 (sgNsd1/2) in mMSCs or Nsd1 alone (sgNsd1) in mESCs using CRISPR/Cas9 (Extended Data Fig. 4a,b). Setd2 was disrupted separately as a control (sgSetd2) (Extended Data Fig. 4a). sgNsd1/2 and sgSetd2 mMSCs showed marked and specific depletion of H3K36me2 and H3K36me3, respectively, suggesting that these enzymes function distinctly at the chromatin level (Extended Data Fig. 4c–e). ChIP-seq with Drosophila chromatin spike-in as an exogenous reference control18 was employed to quantitatively analyze genome-wide changes between parental and H3K36me2/3-depleted cells (Extended Data Fig. 4d,f). A global reduction of H3K36me2 in sgNsd1/2 mMSCs and sgNsd1 mESCs, most prominent at intergenic regions, was observed (Extended Data Fig. 4g,h). In contrast, levels of H3K36me3 were unperturbed and reductions in genic H3K36me2 were relatively modest (Extended Data Fig. 4d–h), potentially owing to the activity of other H3K36 methyltransferases such as NSD3 or ASH1L.
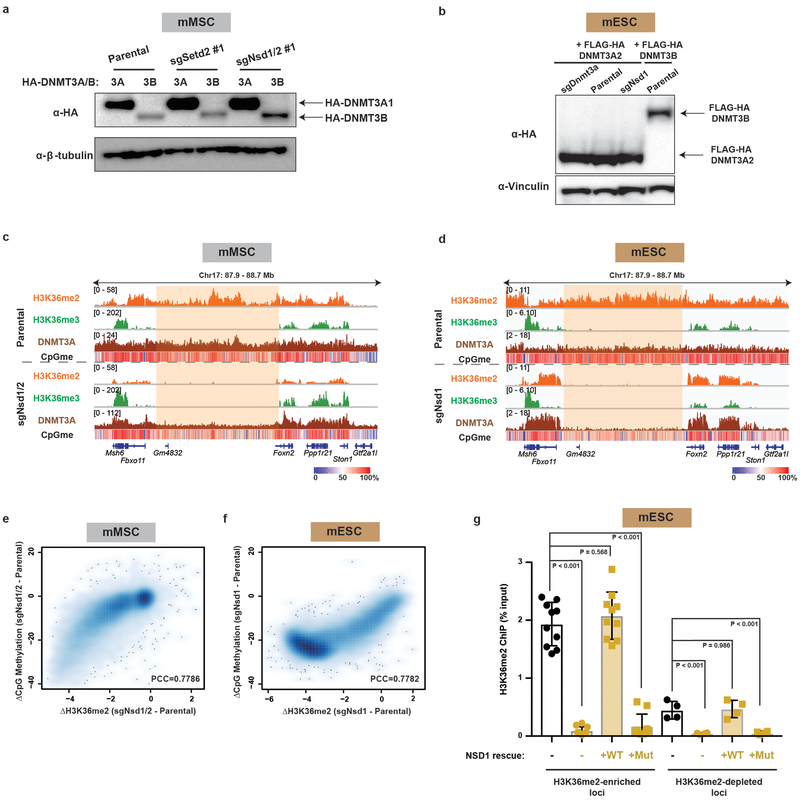
We next profiled genome-wide binding patterns of HA-tagged DNMT3A1 (for mMSCs) and DNMT3A2 (for mESCs) and DNA methylation in H3K36me2-depleted cells (Extended Data Fig. 5a,b). The recruitment of DNMT3A to intergenic regions was abrogated by deletion of NSD family enzymes in both mESCs and mMSCs (Extended Data Fig. 5c,d). Genome-wide analysis revealed that loss of DNMT3A targeting at H3K36me2-depleted regions coincided with reduced CpG methylation (Fig. 2a,c). As predicted by the co-localization between decreases in H3K36me2 and CpG methylation (Extended Data Fig. 5e,f) and the disproportional intergenic enrichment of H3K36me2, CpG hypomethylation in sgNsd1/2 mMSCs and sgNsd1 mESCs predominantly affected intergenic regions (Fig. 2b,d). Reintroduction of wild-type NSD1, but not a catalytic mutant form (C2023A), was able to rescue global and intergenic H3K36me2 levels (Fig. 2e, Extended Data Fig. 4b and 5g). Importantly, intergenic localization of DNMT3A could only be recovered through add-back of wild-type NSD1 (Fig. 2f), pointing to a specific requirement for NSD1-catalyzed H3K36me2 in recruitment of DNMT3A to non-coding euchromatic regions. Thus, we conclude that NSD1 plays an essential and specific role in directing DNMT3A to intergenic regions and maintaining CpG methylation at these sites.
Figure 2: NSD1-mediated H3K36me2 is required for intergenic DNMT3A localization and CpG methylation.
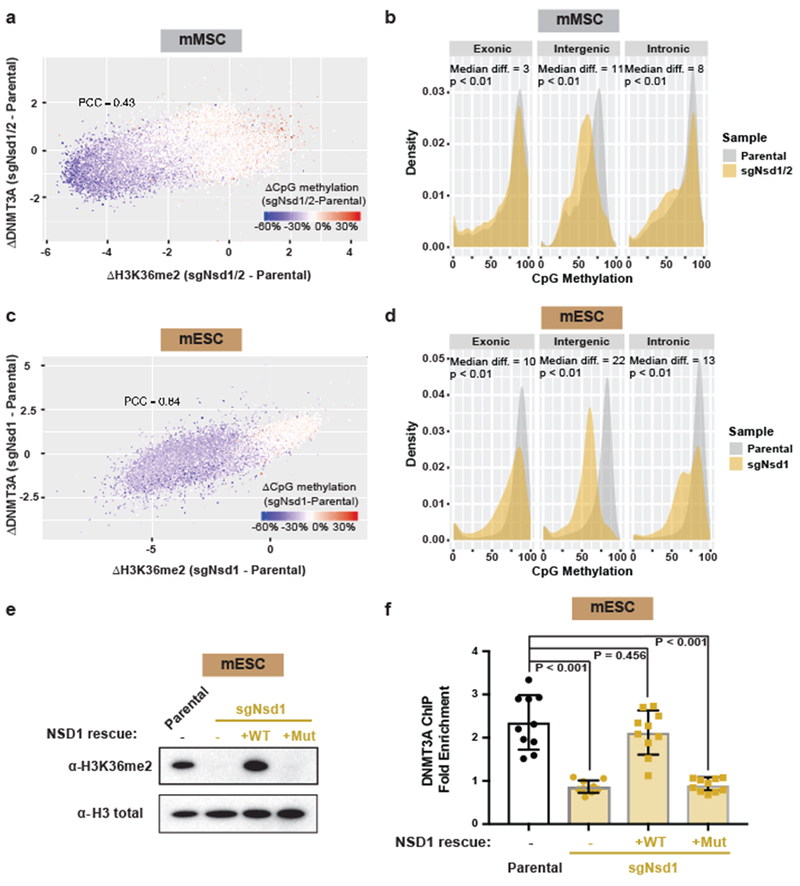
a) Difference in ChIP-seq normalized reads of DNMT3A1 between parental and sgNsd1/2 mMSCs was plotted relative to that of H3K36me2 for 10kb non-overlapping bins (n = 246,285). Each bin/dot was color-coded based on change of averaged CpG methylation to show lost (blue) or gained (red) CpG methylation in sgNsd1/2 cells. Pearson’s correlation coefficient is indicated.
b) Histograms for CpG methylation at intergenic (n = 1,165), exonic (n = 13,601), and intronic (n = 12,364) regions for parental (grey) and sgNsd1/2 (orange) mMSCs. Indicated p-values determined by Wilcoxon’s rank sum test (two-sided).
c) Difference in ChIP-seq normalized reads of DNMT3A2 between parental and sgNsd1 mESCs was plotted relative to that of H3K36me2 for 10kb non-overlapping bins (n = 246,285). Each bin/dot was color-coded based on change of averaged CpG methylation to show lost (blue) or gained (red) CpG methylation in sgNsd1 cells. Pearson’s correlation coefficient is indicated.
d) Histograms for CpG methylation at intergenic (n = 1,165), exonic (n = 13,601), and intronic (n = 12,364) regions for parental (grey) and sgNsd1 (orange) mESCs. Indicated p-values determined by Wilcoxon’s rank sum test (two-sided).
e) Immunoblots of lysates generated from parental and sgNsd1 mESCs for H3K36me2, with total H3 as a loading control. sgNsd1 cells were rescued with ectopic expression of wild-type (WT) or C2023A catalytic mutant (Mut) NSD1. Data are representative of two independent experiments.
f) Fold enrichment of DNMT3A at various H3K36me2-enriched versus H3K36me2-depleted intergenic regions in parental (black) and sgNsd1 (orange) mESCs rescued with ectopic expression of wild-type (WT) or C2023A catalytic mutant (Mut) NSD1 was measured with ChIP-qPCR. Each data point represents a genomic locus (n = 10). Data are mean ± SD. Indicated p-values determined by one-way ANOVA.
For gel source data, see Supplementary Fig. 1.
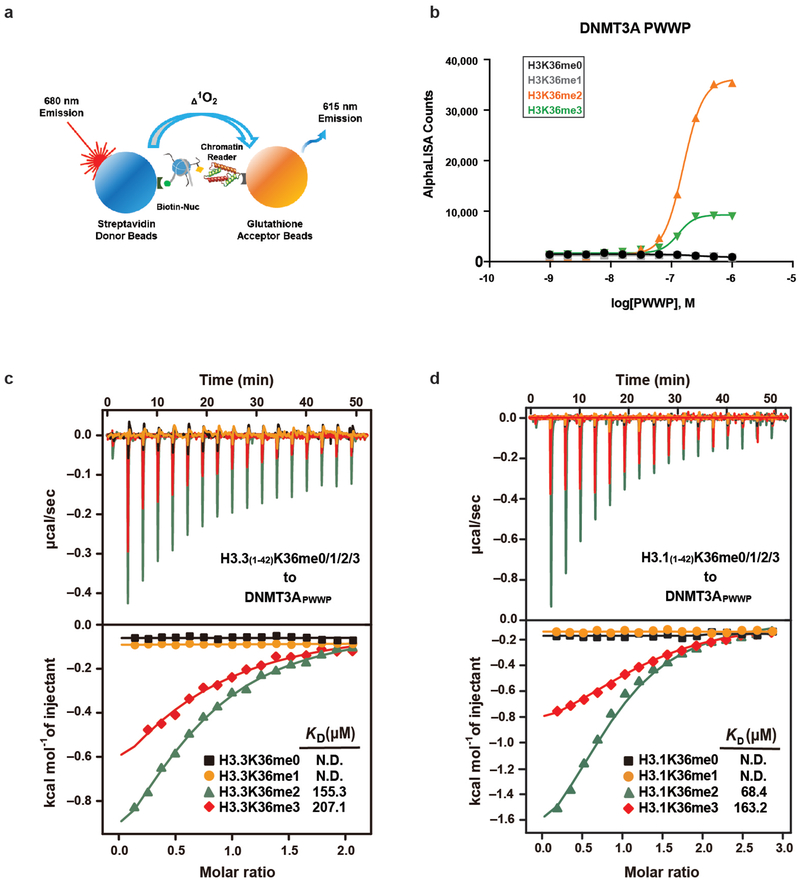
We next sought to elucidate the mechanisms underlying the specificity of DNMT3A recruitment by H3K36me2. Both DNMT3A and DNMT3B contain PWWP ‘reader’ domains that can interact with H3K36 methylation in vitro10,19. To test whether DNMT3APWWP shows specificity towards different valences of H3K36 methylation, we examined interactions between the purified DNMT3APWWP domain and a panel of semi-synthetic nucleosomes (Extended Data Fig. 6a). DNMT3APWWP bound with highest affinity to nucleosomes modified with H3K36me2, followed by H3K36me3, but not H3K36me1 or any valence at H3K4, H3K9, H3K27, or H4K20 (Fig. 3a and Extended Data Fig. 6b). Quantitative isothermal titration calorimetry (ITC) assays with either H3.1 or H3.3 K36-modified peptides and DNMT3APWWP further supported its preferential recognition of H3K36me2/3 (Extended Data Fig. 6c,d). These results indicate that DNMT3APWWP recognizes both methylation states but exhibits greater affinity for H3K36me2.
Figure 3: Preferential recognition of H3K36me2/3 by PWWP-domain of DNMT3A facilitates its localization.
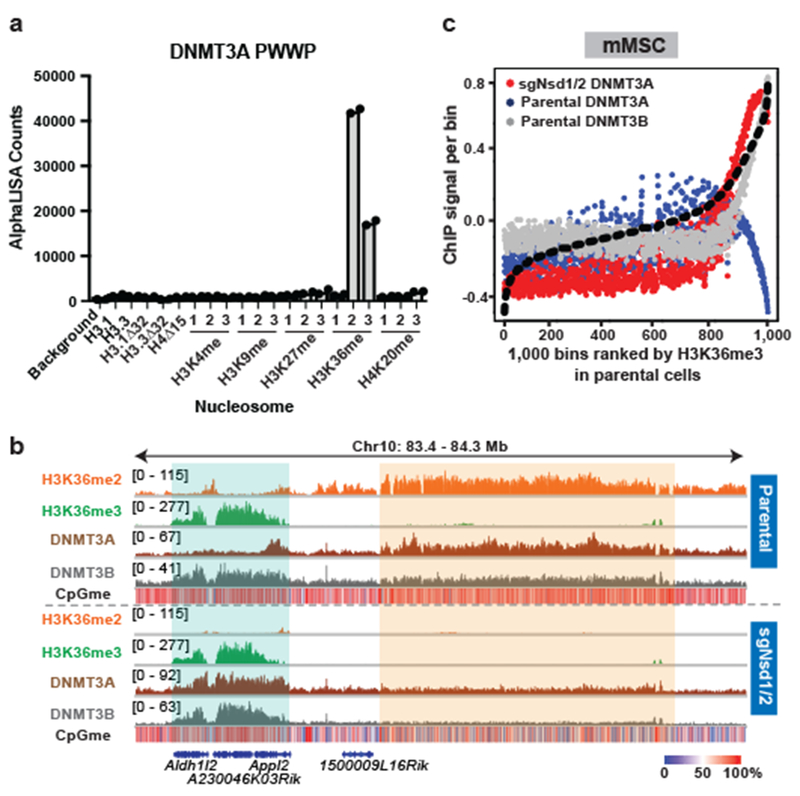
a) AlphaLISA counts for GST-DNMT3APWWP interaction with semi-synthetic modified nucleosomes from two replicates.
b) Genome browser representation of ChIP-seq normalized reads for H3K36me2, H3K36me3, DNMT3A1, and DNMT3B in parental and sgNsd1/2 mMSCs at Chr10: 83.4-84.3 Mb. Levels of CpG methylation are depicted as a heat map (blue/low; white/intermediate; red/high). Refseq genes are annotated at the bottom. Shaded areas indicate H3K36me2-enriched intergenic regions (orange) and H3K36me3-enriched genic regions (green) in parental cells. Upon H3K36me2 depletion, DNMT3A is re-targeted to H3K36me3-enriched gene bodies (eg. Aldh1/2 and Appl2). For H3K36me2, H3K36me3, and DNMT3A1 in parental cells, data are representative of two independent ChIP-seq experiments. For DNMT3B in parental cells, ChIP-seq was performed once and an independent ChIP was performed in which genomic regions of selective enrichment and depletion were confirmed by qPCR. DNMT3A1 and DNMT3B ChIP-seq in sgNsd1/2 cells and WGBS in both lines were performed once.
c) ChIP-seq normalized reads per bin for DNMT3A1 (blue) and DNMT3B (grey) in parental mMSCs and DNMT3A1 (red) in sgNsd1/2 mMSCs relative to H3K36me3. To generate bins, 1kb genomic tiles (n = 2,462,755) were ranked by H3K36me3 enrichment in mMSCs and grouped into 1000 rank-ordered bins (2,463 tiles per group). Dashed line indicates H3K36me3 enrichment per bin.
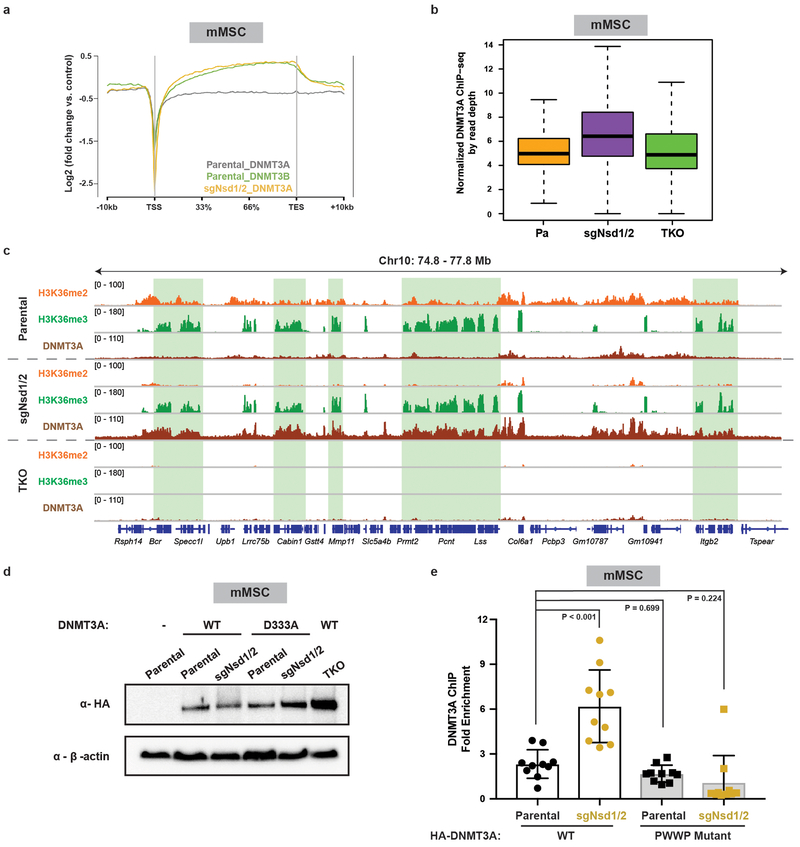
We speculated that such a binding preference, combined with the relative abundance of H3K36me2 (Extended Data Fig. 4e), contributes to the favored enrichment of DNMT3A at intergenic regions. Thus, we tested the hypothesis that DNMT3A will co-localize with H3K36me3 upon depletion of H3K36me2. Indeed, we noted a marked redistribution of DNMT3A to gene bodies in sgNsd1/2 mMSCs (Fig. 3b). This could not be explained through its interaction with residual genic H3K36me2, as DNMT3A now exhibited a binding profile reminiscent of DNMT3B in which signal is enriched toward 3’ end of the gene body (Extended Data Fig. 7a). Furthermore, DNMT3A was found to be depleted at regions of high H3K36me3 in parental mMSCs but was instead enriched at these same regions in sgNsd1/2 cells (Fig. 3b,c). Disruption of SETD2 catalytic activity in sgNsd1/2 cells (TKO) impaired DNMT3A localization to gene bodies, reflecting a requirement for H3K36me3 in DNMT3A genomic re-targeting (Extended Data Fig. 7b,c). Introduction of a point mutation (D333A) in the PWWP domain that impairs its binding to H3K36me2/319 abrogated DNMT3A re-localization to H3K36me3-enriched regions in sgNsd1/2 cells (Extended Data Fig. 7d,e). Taken together, these results suggest that preferential recognition of H3K36me2/3 by the PWWP domain guides DNMT3A localization across the cellular chromatin landscape.
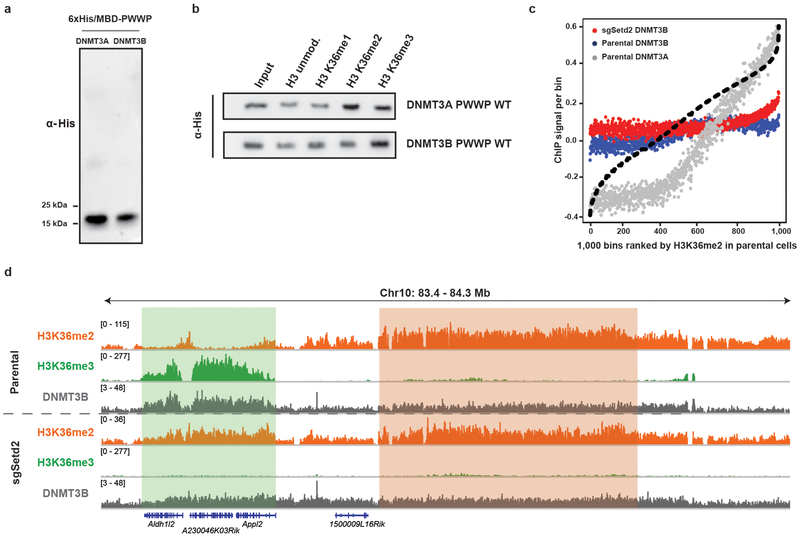
We asked whether a similar redistribution mechanism may occur for DNMT3B. As expected from its localization pattern, the PWWP domain of DNMT3B preferentially binds to H3K36me3 recombinant nucleosomes in vitro (Extended Data Fig. 8a,b). Loss of gene-body localization for DNMT3B in H3K36me3-depleted sgSetd2 mMSCs was accompanied by a relatively modest increase in retargeting to H3K36me2-enriched intergenic regions (Extended Data Fig. 8c,d). In aggregate, these data support H3K36me2/3 ratio as a key determinant for specifying targeting patterns of DNMT3A, and of DNMT3B to a lesser extent.
We have previously reported that a subset of head and neck squamous cell carcinomas (HNSCCs) that are depleted of H3K36me2 due to genetic or biochemical inactivation of NSD1 shows a DNA hypomethylation signature20. Similarly, a significant decrease in DNA methylation was observed in blood samples from Sotos patients with germline NSD1 haploinsufficiency21. To explore the disease relevance of our findings, we profiled H3K36me2 and CpG methylation in patient-derived HNSCC cell lines carrying wild-type (Cal27 and Fadu) or mutant NSD1 (SCC-4 and SKN-3). Despite their heterogeneous genetic background, DNA hypomethylation in NSD1-mutant cell lines tracked closely with genome-wide reductions in H3K36me2 as compared to NSD1-wild-type cell lines and occurred primarily at intergenic regions (Fig. 4a,b). We further analyzed publicly available DNA methylation arrays of HNSCC or Sotos patient samples. Probes that were hypomethylated in NSD1-inactivated compared to NSD1 wild-type HNSCC tumors were significantly enriched for intergenic regions (Fig. 4c). Sotos syndrome patients also exhibited an enrichment of hypomethylated probes at intergenic regions compared to controls (Fig. 4c).
Figure 4: Impaired intergenic DNMT3A localization and CpG methylation in neoplastic and developmental overgrowth.
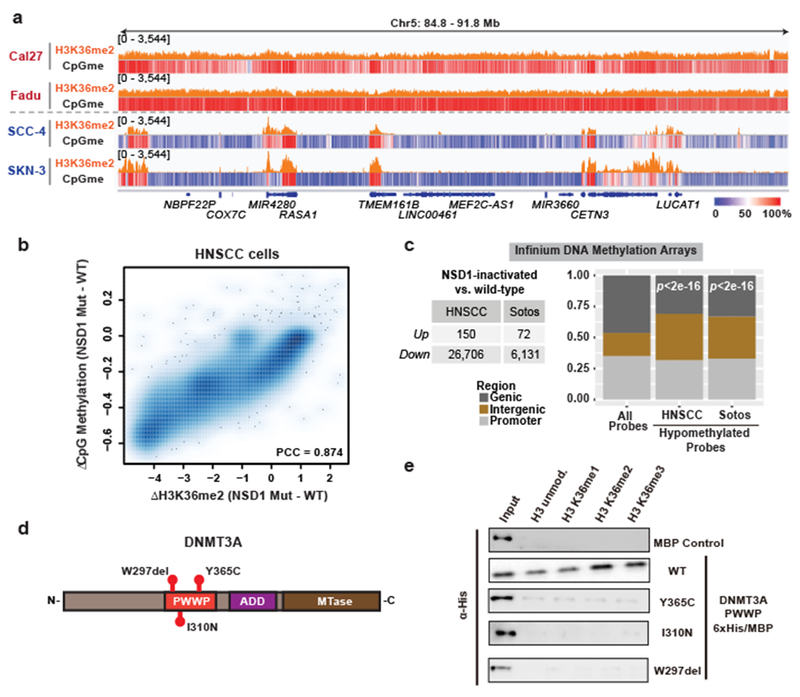
a) Genome browser representation of ChIP-seq normalized reads for H3K36me2 in NSD1 wild-type (Cal27, Fadu) and NSD1 mutant (SCC-4, SKN-3) HNSCC cell lines at Chr5: 84.8-91.8 Mb. Levels of CpG methylation are depicted as a heat map (blue/low; white/intermediate; red/high). Refseq genes are annotated at the bottom. For H3K36me2 in Fadu and SKN-3 lines, data are representative of two independent ChIP-seq experiments. H3K36me2 ChIP-seq in Cal27 and SCC-4 lines and WGBS in all lines were performed once.
b) Percent changes of averaged CpG methylation between NSD1 wildtype and mutant HNSCC cell lines were plotted relative to changes in ChIP-seq normalized reads of H3K36me2 for 100kb non-overlapping bins (n = 28,395). Pearson’s correlation coefficient is indicated.
c) Left, table summarizing number of up- and down-regulated Infinium 450K DNA methylation array probes between NSD1 inactivated vs. NSD1 wild-type HNSCC tumor samples, and Sotos vs. control patient samples. Right, bar graph showing intergenic enrichment of DNA hypomethylated probes relative to all probes (n = 370,898). Indicated p-values determined by chi-squared test.
d) Schematic of DNMT3A conserved structural domains with indicated TBRS-associated mutations.
e) Immunoblots of recombinant His/MBP-tagged DNMT3A wild-type and mutant PWWP domains (Y365C, I310N, and W297del) bound to H3K36-modified recombinant nucleosomes following the in vitro pull-down assay. Data are representative of two independent experiments.
For gel source data, see Supplementary Fig. 1.
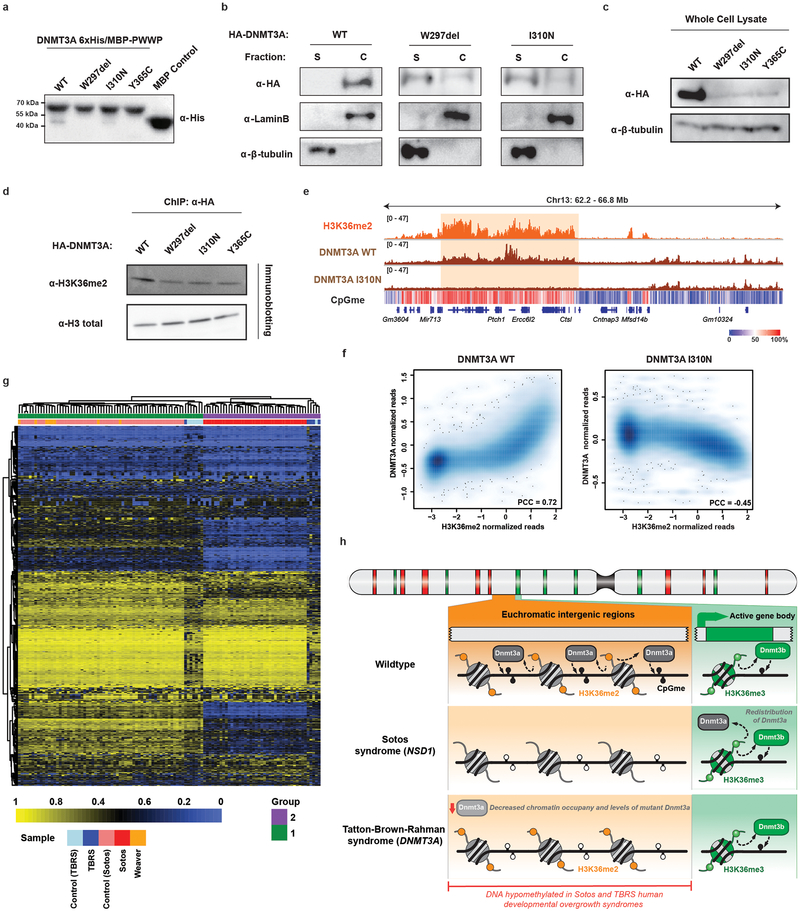
Missense mutations in DNMT3A cause Tatton-Brown-Rahman syndrome (TBRS), a developmental disorder that shares many clinical features with Sotos syndrome including skeletal overgrowth, facial dysmorphism and intellectual disability8,12,22. We characterized TBRS-associated point mutations within the DNMT3A PWWP domain (W297del, I310N, Y365C) (Fig. 4d). Recombinantly expressed DNMT3A PWWP domains carrying these mutations showed reduced nucleosome binding in vitro (Fig. 4e, Extended Data Fig. 9a), suggesting that they may impair chromatin recruitment of DNMT3A. Indeed, W297del and I310N mutations reduced the association of DNMT3A with bulk chromatin (Extended Data Fig. 9b), which was accompanied by reduced protein levels as recently reported23 (Extended Data Fig. 9c). Further examination of chromatin-bound wild-type, W297del, I310N or Y365C mutant DNMT3A revealed a substantial decrease in the levels of H3K36me2 on nucleosomes in complex with mutant DNMT3A (Extended Data Fig. 9d). Accordingly, ChIP-seq analysis showed that the I310N mutation abrogated targeting of DNMT3A to H3K36me2 genome-wide (Extended Data Fig. 9e,f). Thus, impaired recruitment of DNMT3A and reduced CpG methylation at H3K36me2-enriched intergenic euchromatic regions appear to be common features associated with TRBS and Sotos syndrome. In support of this notion, unsupervised hierarchical clustering of published DNA methylation array profiles21,24 indicated that patients with Sotos syndrome, but not EZH2 mutation-associated Weaver syndrome22, shared a similar DNA methylome with TBRS patients (Extended Data Fig. 9g).
Our findings provide an enhanced framework for understanding how DNA methylation landscapes are established and maintained in the euchromatic genome. Preferential targeting of DNMT3A and DNMT3B, guided by their PWWP chromatin reader domains, directs CpG methylation to H3K36me2-enriched intergenic regions and H3K36me3-enriched gene bodies, respectively (Extended Data Fig. 9h). Simultaneously, the presence of H3K4me3 at active promoters disrupts the interaction between the ADD domain of DNMT3A/B and histone H3, thereby protecting these regions from ectopic methylation9. Depletion of DNA methylation at promoters is further ensured through the recruitment of several CXXC domain-containing proteins that preferentially recognize CpG-dense promoters, including TET family enzymes involved in active DNA demethylation and the H3K36 demethylase KDM2B25,26. In such a manner, we propose that CpG methylation is established across broad euchromatic regions through the combined actions of DNMT3A/B while focal sites of transcriptional initiation are spared. Our findings, however, do not exclude the possibility that DNMT1 activity is also regulated by H3K36 methylation. Furthermore, structural characterization of DNMT3A/B bound to H3K36me2/3 will be necessary to determine the basis of selective recognition by their PWWP domains.
Importantly, our studies demonstrate that intergenic DNA hypomethylation resulting from a dysfunctional NSD1-DNMT3A trans-regulatory pathway represents a mechanistic link between two phenotypically overlapping human overgrowth syndromes (Extended Data Fig. 9h). This pathway is also likely to facilitate tissue neoplastic overgrowth. Loss of Nsd1 or Dnmt3a promotes tumor development in mouse models of squamous cell carcinomas27,28. Somatic mutations in DNMT3A are common in acute myeloid leukemia, a malignancy where recurrent translocations that fuse NSD1 to NUP98 leading to aberrant localization of NSD1 are also observed5,29. Notably, germline mutations in additional epigenetic regulators, including EZH2 and histone H1, cause Sotos- and TRBS-like developmental disorders25. Furthermore, gain-of-function mutations in DNMT3A that result in ectopic DNA hypermethylation at polycomb repressive domains were recently found to cause delayed growth and microcephly in mice and human23,30. Thus, future work is warranted to dissect the complex chromatin regulatory network governing the DNA methylation landscape across broad euchromatic regions in the control of cellular differentiation and growth.
Methods
Plasmid construction and lentivirus production for cell culture
sgRNAs directed against mouse Dnmt3a, Nsd1, Nsd2, and Setd2 were cloned into px458 (Addgene #48138, a gift from Feng Zhang). Mouse Dnmt3a and Dnmt3b cDNA sequences from Horizon Dharmacon were cloned into pCDH-EF1-MCS-Neo and piggybac (pCAGGS-IRES-Neo, a gift from H. Niwa, Institute of Molecular Embryology and Genetics, Kumamoto, Japan) with an N-terminal FLAG-HA epitope tag using Gibson assembly (NEB). Mouse Nsd1 cDNA from Horizon Dharmacon was cloned into pPB-CAG-3xFLAG-empty-pgk-hph (Addgene #48754, a gift from Austin Smith) using Gibson assembly. Standard site-directed mutagenesis techniques were used to generate C2023A in Nsd1 and the TRBS missense mutations W297del, I310N and Y365C corresponding to mouse Dnmt3a residues W293, I306 and Y361 respectively. To produce lentivirus, 293T cells were transfected with the lentiviral vector and helper plasmids (psPAX2, pVSVG). Supernatant containing lentivirus was collected and filtered 48 hours later for transduction.
Cell culture, CRISPR/Cas9 gene editing, and generation of stable cell lines
293T (ATCC) and C3H10T1/2 (ATCC) cells were cultured in Dulbecco’s modified Eagles’ medium (DMEM, Invitrogen) with 10% fetal bovine serum (FBS, Sigma). Fadu (ATCC), SKN-3 (JCRB cell bank), Cal27 (ATCC), SCC-4 (ATCC) cells were cultured in DMEM:F12 medium (Invitrogen) with 10% FBS. V6.5 mouse embryonic stem cells (C57BL/6 × 129S4/SvJae F1) were maintained on gelatin-coated plates in Knockout DMEM (Gibco) supplemented with 15% ES-cell-qualified FBS (Gemini), 0.1 mM 2-mercapoethanol, 2mM L-glutamine (Life technologies) and LIF. Drosophila S2 cells were cultured in Schneider’s Drosophila Medium (Invitrogen) containing 10% heat-inactivated FBS. All cell lines tested negative for mycoplasma contamination. To generate knockout lines, mESCs and C3H10T1/2 cells were transfected with sgRNA-containing px458 using Xfect mESC transfection reagent (Takara) or Lipofectamine 2000 (Invitrogen), incubated for forty-eight hours, and single GFP+ cells sorted into 96 well plates. Clones were expanded, screened for global reduction of H3K36me2/3 by immunoblot, and individually verified by Sanger sequencing of the target loci (Supplementary Table 1). To generate transgenic C3H10T1/2 lines expressing epitope-tagged DNMT3A/B, cells were transduced with concentrated lentivirus as previously described20. Transduced cells were grown under G418 selection (1000 μg/ml) 48hrs after transduction and selected for one week before being harvested for immunoblot or ChIP-seq. To generate transgenic mESC lines, ~5×10⁶ cells were electroporated with piggybac expression vectors plus transposase (pBase) in a 3/1 ratio using Amaxa ESC Nucleofector Kit (VPH-1001, program A-023, Lonza). Cells were plated on gelatin-coated plates and grown under G418 selection (500 μg/ml) or Hygromycin selection (100 μg/ml) 48hrs after electroporation for at least 2 passages before being harvested for immunoblot or ChIP-seq analysis.
Immunoblotting
Fractionated or whole cell lysates were resolved by SDS-PAGE, transferred to a nitrocellulose or PVDF membrane, blocked in 5% non-fat milk in PBS plus 0.5% Tween-20, probed with primary antibodies, and detected with horseradish peroxidase-conjugated anti-rabbit or anti-mouse secondary antibodies (GE Healthcare). Primary antibodies were: anti-H3K36me2 (Cell Signaling Tech, 2901), anti-H3K36me3 (Active Motif, 61101), anti-NSD1 (Abbexa, abx135901), anti-NSD2 (Millipore Sigma, MABE191), anti-SETD2 (Abcam, ab31358), anti-DNMT3A (Abcam, ab188470), anti-Vinculin (Cell Signaling Tech, 13901), anti-His (ZSGB-Bio,TA-02), anti-Lamin B1 (Cell Signaling Tech, 12586), anti-β-Tubulin (Cell Signaling Tech, 2128), anti-β-actin (Abcam, ab8224), anti-H3 (Abcam, ab1791) and anti-HA (Biolegend, 901501). The specificities of anti-H3K36me3 and anti-H3K36me2 antibodies were validated using Setd2 knockout and Nsd1/2 double knockout cell lines.
Histone acid extraction, histone derivatization and PTM analysis by nano-liquid chromatography-mass-spectrometry (nano-LC-MS)
Cells were lysed in nuclear isolation buffer (15 mM Tris pH 7.5, 60 mM KCl, 15 mM NaCl, 5 mM MgCl2, 1 mM CaCl2, 250 mM sucrose, 10 mM sodium butyrate, 1 mM DTT, 500 µM AEBSF, 5 nM microcystin) containing 0.3% NP-40 alternative on ice for 5 min. Nuclei were pelleted and resuspended in 0.4 N H2SO4 followed by 1.5 hr rotation at 4°C. After centrifugation, supernatants were collected, proteins were precipitated in 33% TCA overnight on ice, washed with acetone, and resuspended in deionized water. Acid-extracted histones (5-10 μg) were resuspended in 100 mM ammonium bicarbonate (pH 8), derivatized using propionic anhydride and digested with trypsin as previously described31. After a second round of propionylation the resulting histone peptides were desalted using C18 Stage Tips, dried using a centrifugal evaporator, and reconstituted using 0.1% formic acid in preparation for LC-MS analysis. Nanoflow liquid chromatography was performed using a Thermo Scientific™ Easy nLC™ 1000 equipped with a 75 µm x 20 cm column packed in-house using Reprosil-Pur C18-AQ (3 µm; Dr. Maisch GmbH, Germany). Buffer A was 0.1% formic acid and Buffer B was 0.1% formic acid in 80% acetonitrile. Peptides were resolved using a two-step linear gradient from 5% to 33% B over 45 min, then from 33% B to 90% B over 10 min at a flow rate of 300 nL/min. The HPLC was coupled online to an Orbitrap Elite mass spectrometer operating in the positive mode using a Nanospray Flex™ Ion Source (Thermo Scientific) at 2.3 kV. Two full MS scans (m/z 300-1100) were acquired in the orbitrap mass analyzer with a resolution of 120,000 (at 200 m/z) every 8 DIA MS/MS events using isolation windows of 50 m/z each (e.g. 300-350, 350-400…650-700). MS/MS spectra were acquired in the ion trap operating in normal mode. Fragmentation was performed using collision-induced dissociation (CID) in the ion trap mass analyzer with a normalized collision energy of 35. AGC target and maximum injection time were 5e5 and 50 ms for the full MS scan, and 3e4 and 50 ms for the MS/MS can, respectively. Raw files were analyzed using EpiProfile 2.032. The area for each modification state of a peptide was normalized against the total signal for that peptide to give the relative abundance of the histone modification.
dCypher nucleosome binding assays
5 μL of 250 nM GST-DNMT3A (Active Motif, 31541) was incubated with 5 μL of 10nM biotinylated nucleosomes (EpiCypher, 16-9001) for 30 minutes at room temperature in Binding buffer (20 mM Hepes pH 7.5, 250 mM NaCl, 0.01% BSA, 0.01% NP-40, 1 mM DTT) in a 384-well plate. A mix of 10 uL of 2.5 μg/mL glutathione acceptor beads (PerkinElmer, AL109M) and 5 μg/mL streptavidin donor beads (PerkinElmer, 6760002) was prepared in Bead Buffer (20 mM Hepes pH 7.5, 250 mM NaCl, 0.01% BSA, 0.01% NP-40) and added to each well. The plate was incubated at room temperature in subdued lighting for 60 minutes and AlphaLISA signal measured on a PerkinElmer 2104 EnVision (680 nm laser excitation, 570 nm emission filter +/− 50 nm bandwidth). Each binding interaction was performed in duplicate.
Nucleosome Pull-Down Assays
1 μg biotinylated nucleosomes (Epicypher, 16-0006; 16-0322; 16-0319; 16-0320) were immobilized on 10 μL of BSA blocked Dynabeads MyOne Streptavidin C1 (Invitrogen, 65001) in 20 mM Tris pH 7.5, 100 mM NaCl, 0.1% NP40 and 1 mM DTT buffer plus protease inhibitors (Selleck, K4000) for 30 min on ice. The beads were then incubated with 1 μM or 10 μM His-tagged DNMT3APWWP or DNMT3BPWWP proteins at 4°C for 4h. After five washes with 1 mL of binding buffer, the protein-bound beads were pooled and the pull-down products were analyzed by Western blotting with α-His antibody (ZSGB-Bio, TA-02).
The recombinant DNMT3APWWP and DNMT3BPWWP proteins for nucleosome pull-down assays were prepared by the following procedures: the DNMT3APWWP (residues 278-427) domains of wild type and mutant human DNMT3A were cloned into a modified pRSFDuet vector with an N-terminal 6xHis-MBP tag. Recombinant proteins were overexpressed in E.coli strain BL21 (DE3) induced by 0.2 mM isopropyl-1-thio-D-galactopyranoside (IPTG) at 16°C overnight. Cells were harvested and resuspended in buffer containing 20 mM Tris, pH 8.0, 300 mM NaCl, and 5% glycerol. After cell lysis and centrifugation, proteins were purified by Dextrin Beads 6FF (Smart-Lifesciences, SA026100) and eluted with 20 mM maltose elution buffer. The eluted proteins were further purified by gel filtration Superdex 200 10/300 GL (GE Healthcare). Human DNMT3BPWWP (residues 206-355) was cloned into pET28b vector and then expressed at 16 °C overnight. The protein was purified by HisTrap column and Superdex 75 10/300 (GE Healthcare). All gel filtration buffer contained 20mM Tris–HCl pH 7.5 and 100mM NaCl for the nucleosome pull-down assay. Protein purity was analyzed by SDS-PAGE and western blot. Proteins concentrations were determined by UV spectroscopic measurement at 280 nm.
Recombinant DNMT3APWWP expression and ITC titration assay
The PWWP domain (residues 278-427) of human DNMT3A (DNMT3APWWP) was sub-cloned into a modified pET28b vector with an N-terminal 6xHis-GB1 tag. Recombinant protein was overexpressed in E. coli BL21 (DE3) induced by 0.2 mM isopropyl-1-thio-D-galactopyranoside (IPTG) at 16°C overnight. Cells were harvested and resuspended in buffer containing 20mM Tris, pH 7.5, 300 mM NaCl, 10 mM imidazole and 5% glycerol. After cell lysis and centrifugation, the His-GB1-DNMT3APWWP supernatant was purified by a HisTrap column (GE Healthcare). After PreScission protease digestion to cleave the 6xHis-GB1 tag, DNMT3APWWP was further purified on a HiTrap Heparin HP Column (GE Healthcare). The protein sample was finally polished over a Superdex75 10/300 GL (GE Healthcare) column in buffer containing 20mM Tris, pH 7.5 and 150mM NaCl.
Isothermal titration calorimetry (ITC) was performed at 25°C with a MicroCal PEAQ-ITC (Malvern Panalytical). DNMT3APWWP was exchanged to ITC buffer containing 150 mM NaCl and 20 mM Hepes-Na, pH 7.4 by gel filtration. Lyophilized peptide was directly dissolved in ITC buffer for titration. Concentrations of DNMT3APWWP and H3.31-42 or H3.11-42 peptides were 0.2 mM and 2 mM, respectively. Protein concentration was determined by the UV280nm absorbance. Peptides were quantified by weighing on a large scale. Acquired ITC data were analyzed by Origin 8.0 (GE Healthcare) using the “One Set of Binding Sites” fitting model.
Chromatin Fractionation
C3H10T1/2 cells were washed with PBS and lysed in Buffer A (10 mM HEPES, 10 mM KCl, 1.5 mM MgCl2, 0.34 M Sucrose, 10% Glycerol, 0.5 mM PMSF, 0.1% TritonX-100) on ice for 8 min. Centrifugation was carried out at 1,300 x g at 4°C for 5 min and supernatant was collected (cytosolic fraction). The nuclei pellet was further lysed in Buffer B (3 mM EDTA, 0.2 mM EGTA, 0.2 mM PMSF) on ice for 30 min and centrifugation performed (1,700 x g at 4°C for 5 min) to obtain the supernatant (nuclear soluble fraction). Cytosolic and nuclear soluble fractions were combined to make the soluble fraction. The insoluble pellet was lysed in SDS sample loading buffer, boiled, and sonicated to yield the chromatin fraction. The protein concentration of each fraction was measured and equal amounts analyzed by immunoblot.
Chromatin Immunoprecipitation
Cross-linking ChIP in mMSCs and mESCs was performed using ~2×10⁷ cells per immunoprecipitation. Prior to fixation, media was aspirated and cells washed once with PBS. Cells were cross-linked directly on the plate using 1% paraformaldehyde for 5 min at room temperature with gentle shaking and glycine added to quench (final concentration 125 mM, incubated for 5 min at room temperature). Cells were washed once with cold PBS, scraped off the plates, and pelleted. To obtain a soluble chromatin extract, cells were resuspended in 1 mL LB1 (50 mM HEPES, 140 mM NaCl, 1 mM EDTA, 10% glycerol, 0.5% NP-40, 0.25% Triton X-100, 1x Complete protease inhibitor) and incubated rotating at 4°C for 10 min. Samples were centrifuged, resuspended in 1 mL LB2 (10 mM Tris-HCl pH 8.0, 200 mM NaCl, 1 mM EDTA, 0.5 mM EGTA, 1x Compete protease inhibitor), and incubated rotating at 4°C for 10 min. Finally, samples were centrifuged, resuspended in 1 mL LB3 (10 mM Tris-HCl pH 8.0, 100 mM NaCl, 1 mM EDTA, 0.5 mM EGTA, 0.1% Na deoxycholate, 0.5% N-lauroylsarcosine, 1% Triton X-100, 1x Complete protease inhibitor), and homogenized by passing two times through a 27-gauge needle. Chromatin extracts were sonicated for 8 min (anti-HA ChIP) or 12 min (anti-histone PTM ChIP) using a Covaris E220 focused ultra-sonicator at peak power 140, duty factor 5, and cycles/burst 200. For histone PTM ChIP-Rx, after centrifugation soluble chromatin was spiked-in with soluble chromatin from Drosophila S2 cells that was similarly prepared and equivalent to 5-10% of the mouse/human cell chromatin. The lysates were incubated with 100 μl Pierce anti-HA beads (Themo Scientific, 88836) or with anti-H3K4me1 (Abcam, ab8895), anti-H3K9me3 (Abcam, ab8898), anti-H3K27ac (Active Motif, 39133), anti-H3K27me3 (Cell Signaling Tech, 9733), anti-H3K36me2 (Cell Signaling, 2901) or anti-H3K36me3 (Active Motif, 61101) antibodies bound to 75 μl protein A or protein G Dynabeads (Invitrogen) and incubated overnight at 4°C with 5% kept as input DNA. Magnetic beads were sequentially washed with low salt buffer (150 mM NaCl; 0.1% SDS; 1% Triton X-100; 1 mM EDTA; 50 mM Tris-HCl), high salt buffer (500 mM NaCl; 0.1% SDS; 1% Triton X-100; 1 mM EDTA; 50 mM Tris-HCl), LiCl buffer (150 mM LiCl; 0.5% Na deoxycholate; 0.1% SDS; 1% Nonidet P-40; 1 mM EDTA; 50 mM Tris-HCl) and TE buffer (1 mM EDTA; 10 mM Tris-HCl). For ChIP-seq, beads were resuspended in elution buffer (1% SDS, 50 mM Tris-HCl pH 8.0, 10mM EDTA, 200 mM NaCl) and incubated for 30 min at 65°C. After centrifugation the eluate was reverse cross-linked overnight at 65°C. The eluate was then treated with RNaseA for 1 hr at 37°C and with Proteinase K (Roche) for 1 hr at 55°C and DNA was recovered using Qiagen PCR purification kit. For ChIP-Immunoblot, TE washes were replaced with TBS 0.1% Tween-20, and the beads were resuspended in Laemmli buffer and boiled to de-crosslink proteins before separation by SDS-PAGE. For HNSCC lines, sonication was performed on a BioRuptor UCD-300 for 60 cycles at 4°C, 10s on followed by 20s off, centrifuging every 15 cycles, and ChIP-Rx for H3K36me2 (Cell Signaling, 2901) using 2% S2 chromatin spike-in was performed on a Diagenode SX-8G IP-Star Compact using Diagenode Automated Ideal ChIP-seq kit according to manufacturer’s instructions.
ChIP-qPCR & ChIP-sequencing (ChIP-seq)
ChIP-qPCR was performed using the Applied Biosystems StepOnePlus system and SYBR green dye. Primers are listed in Supplementary Table 2. Fold enrichment was calculated by dividing the enrichment (% input) at individual genomic loci by the averaged signal from multiple negative control regions (e.g. H3K36me2-depleted intergenic loci). For ChIP-seq, library preparation was carried out using KAPA HTP Illumina or KAPA Hyper Prep library preparation reagents following the manufacturer’s protocol. ChIP libraries were sequenced using Illumina HiSeq 2000, 2500 or 4000 at 50bp single reads.
RNA-sequencing
Total RNA was extracted from cell pellets using the AllPrep DNA/RNA/miRNA Universal Kit (Qiagen) according to instructions from the manufacturer. Library preparation was performed with ribosomal RNA (rRNA) depletion according to instructions from the manufacturer (Epicentre) to achieve greater coverage of mRNA and other long non-coding transcripts. Paired-end sequencing (125 bp) was performed on the Illumina HiSeq 2500 or 4000 platform.
Whole Genome Bisulfite Sequencing (WGBS)
Whole-genome sequencing libraries were generated from 1000 ng of genomic DNA spiked with 0.1% (w/w) unmethylated λ DNA (Roche Diagnostics) previously fragmented to 300-400 bp peak sizes using the Covaris focused-ultrasonicator E210. Fragment size was controlled on a Bioanalyzer High Sensitivity DNA Chip (Agilent), and the KAPA High Throughput Library Preparation Kit (KAPA Biosystems) or NxSeq AmpFREE Low DNA Library Kit (Lucigen) applied. End repair of the generated dsDNA with 3′ or 5′ overhangs, adenylation of 3′ ends, adaptor ligation, and clean-up steps were carried out as per manufacturer’s recommendations. The cleaned-up ligation product was then analyzed on a Bioanalyzer High Sensitivity DNA Chip (Agilent). Samples were then bisulfite converted using the EZ-DNA Methylation Gold Kit (Zymo Research) according to the manufacturer’s protocol. DNA was amplified by 9 cycles of PCR using the Kapa Hifi Uracil + DNA polymerase (KAPA Biosystems) according to the manufacturer’s protocol. The amplified libraries were purified using Ampure XP Beads (Beckman Coulter), validated on Bioanalyzer High Sensitivity DNA Chips, and quantified by PicoGreen. Sequencing of the WGBS libraries was performed on the Illumina HiSeqX system using 150-bp paired-end sequencing.
Analysis of ChIP-seq data
Raw sequencing reads were aligned using BWA33 version 0.7.17 with default parameters to hg19, mm10 and dm6 for human, mouse and drosophila data, respectively. Aligned reads were summed into bins according to different annotations (CpG islands (CGIs), promoters, genic regions, 1kb, 10kb and 100kb bins) using bedtools34 version 2.22.1. Annotations of CGIs and RefSeq transcripts for hg19 and mm10 genomes were downloaded from UCSC Table Browser. Promoters were defined as 5kb regions centered on RefSeq TSS. For genic regions, we used the longest isoform. ChIP-Seq coverage tracks were generated and visualized using IGV 2.335,36. The ChIP enrichment was computed using ChIP-Rx (ChIP with reference exogenous genome), which uses spike-in Drosophila chromatin as internal control18. For each ChIP-Seq profile, the ChIP-Rx ratio (denoted as Rx) was calculated as follows:
Where SP and SP_dmel are the percentages of reads in the target sample mapped to mouse (or human) and spike-in Drosophila genome respectively (analogously, IP and IP_dmel for input). Tracks were normalized by dividing by the total sequencing depth and multiplying by the ChIP-Rx ratio. The signal was multiplied by 10^10 in all samples. For ChIP-Seq data analysis, binned reads were divided by total sequencing depth and normalized over input (using log2). De novo methylation plots were generated as in Baubec et al.10
To call broad domains of H3K36me2, H3K27me3 and H3K9me3, ChIP signals (after input normalization) were segmented to identify changes in signal average and variance using PELT37,38. Segments were merged within a distance of 10bp, and then segments >500kb outputted as the large domains. Bedtools was used to aggregate the signals of CpG methylation, gene expression, and ChIP within these broad domains.
Gene body plots were generated using ngs.plot.r39 with fragment length of 300bp and a flanking length of 10kb. For gene coordinates, we used a BED file of the top 50% most expressed genes, sorted by distance between the TSS and first internal exon, relative to total gene length, when appropriate.
Annotated genomic regions within H3K36me2 domains were identified by a custom PERL script. ChIP-seq reads for H3K36me2 and H3K36me3 in these regions were observed by featureCounts40. Expected ChIP-seq reads with equivalent total reads number for H3K36me2 and H3K36me3 in the same regions were simulated by the “shuffle” function of Bedtools.
Analysis of RNA-seq data
Raw sequencing reads were aligned using STAR41 version 2.5.3a to the reference genomes mentioned above. Gene-level read counts were obtained from featureCounts40 v1.5.3 using the USCS gene annotation and normalized to total sequencing depth.
Analysis of WGBS data
Raw reads were aligned to mouse or human genome builds (UCSC mm10 or hg19) using BWA33 (version 0.6.1) after converting the reference genome to bisulfite mode. Low-quality sequence at the 3′ ends were trimmed. For the overlapping paired-end reads, we clipped the 3′ end of one of them to avoid double counting on both forward and reverse strand. After alignment, we filtered duplicated or poorly mapping reads (>2% mismatches or aberrant insert size). To call methylation of individual CpGs, we used Samtools42 (version 0.1.18) mpileup. We filtered CpGs with less than 5x coverage, overlapping with SNPs from dbSNPs (build 137), or located within the ENCODE DAC blacklisted regions or Duke excluded regions43. For visualization in IGV, the coordinates of individual CpGs were artificially extended to the midpoint between their neighbors, as previously described44. Partially methylated domains (PMDs), were called in a similar fashion45. Average methylation levels were computed in 10 kb bins and neighboring bins with methylation levels <70% merged into putative PMDs. Only regions >1mb were considered true PMDs.
DNA methylation clustering
Illumina HumanMethylation450 BeadChip methylation beta values of Tatton-Brown-Rahman Syndrome (TBRS), Sotos Syndrome and Weaver Syndrome patient and control samples were obtained from the GEO database (accession numbers: GSE74432, GSE128801). After removing probes that are on the sex chromosomes, unsupervised hierarchical clustering was performed using the 1,000 most variable sites between TBRS patient and control samples. Clustering was performed using the pheatmap R function (Pretty Heatmaps v1.0.10) with parameters: clustering_method = ‘complete’, clustering_distance_cols = ‘euclidean’, and cutree_cols = 2.
Data Availability
The WGBS, ChIP-seq, and RNA-seq data have been deposited in the Gene Expression Omnibus (GEO) database under accession number GSE118785.
Code Availability
Source code for bioinformatic analysis is available upon request.
Extended Data
Extended Data Figure 1: H3K36me2/3 mark transcriptionally active euchromatin.
a) ChIP-seq normalized reads of H3K36me2 were plotted relative to averagepercentage of CpG methylation in mMSCs for 100kb non-overlapping bins (n = 25,624). Pearson’s correlation coefficient is indicated.
b) Quantification of ChIP-seq normalized reads for DNMT3A1, DNMT3B and averagedCpG methylation within H3K36me2/3 (n = 591), H3K27me3 (n = 283), or H3K9me3 (n = 545) domains. P-values were < 2.2 × 10⁻¹⁶ for all pair-wise comparisons as determined by Wilcoxon’s rank sum test (two-sided), except for DNMT3B (P = 3.73 × 10⁻¹⁴) between H3K27me3 and H3K9me3 domains. Boxes represent median and 25th-75th percentiles, whiskers are minimum to maximum with discrete points representing outliers.
c) Quantification of ChIP-seq normalized reads for gene expression, H3K4me1 andH3K27ac within H3K36me2/3 (n = 591), H3K27me3 (n = 283), or H3K9me3 (n = 545) domains. P-values were < 2.2 × 10⁻¹⁶ for all pair-wise comparisons as determined by Wilcoxon’s rank sum test (two-sided), except for gene expression (P = 1.72 × 10⁻⁶) between H3K27me3 and H3K9me3 domains. Boxes represent median and 25th-75th percentiles, whiskers are minimum to maximum with discrete points representing outliers.
d) 3D genome browser representation of Hi-C chromatin conformation data from mousemyoblasts compared to ChIP-seq normalized reads for histone PTMs in mMSCs at Chr4: 52.2-99.1 Mb. Levels of CpG methylation are depicted as a heat map (blue/low; white/intermediate; red/high). Refseq genes are annotated at the bottom. For H3K36me3 and H3K36me2, data are representative of two independent ChIP-seq experiments; for H3K27me3 and H3K9me3, ChIP-seq was performed once and an independent ChIP was performed in which genomic regions of selective enrichment and depletion were confirmed by qPCR. WGBS was performed once.
Extended Data Figure 2: Distinct enrichment patterns between H3K36me2 and H3K36me3 at euchromatin.
a) Genome browser representation of ChIP-seq normalized reads for H3K36me3,H3K36me2, DNMT3A1, and DNMT3B in mMSCs at Chr8: 75.0-75.1 Mb. Levels of CpG methylation are depicted as a heat map (blue/low; white/intermediate; red/high). Refseq genes are annotated at the bottom. For H3K36me3, H3K36me2, and DNMT3A1, data are representative of two independent ChIP-seq experiments; for DNMT3B, ChIP-seq was performed once and an independent ChIP was performed in which genomic regions of selective enrichment and depletion were confirmed by qPCR. WGBS was performed once.
b) Ratio of observed to expected ChIP-seq reads for H3K36me2 and H3K36me3 inannotated genomic regions. Numbers of expected reads were generated assuming equivalent genomic distribution to input.
c) Heat maps representing ChIP-seq signal density for H3K36me2 and H3K36me3 inmMSCs across all gene bodies. Genes are ranked by first intron length. Each gene is displayed as a row.
d) Averaged ChIP-seq normalized signal across gene bodies stratified by expressionquartile, represented as log2 fold-change over input for DNMT3A1 (above) and DNMT3B (below) in parental mMSCs. Sample sizes (same for DNMT3A1 and DNMT3B) are: n = 7,524, 7,435, 6,923, 8,550 for 1st, 2nd, 3rd, and 4th quartile respectively; n = 35,777 for “Average”.
Extended Data Figure 3: Genome-wide co-localization between H3K36me2 and DNMT3A2 in mESCs.
a) Immunoblots of lysates generated from parental and sgDnmt3a mESCs ectopically expressing HA-tagged DNMT3A2. Vinculin was used as a loading control. Endogenous expression of the long isoform (DNMT3A1) and short isoform (DNMT3A2) are indicated. Data are representative of two independent experiments.
b) ChIP-seq normalized reads of HA-tagged DNMT3A2 in sgDnmt3a mESCs wereplotted relative to in parental mESCs for 100kb non-overlapping bins (n = 26,181). Pearson’s correlation coefficient is indicated.
c) Genome browser representation of ChIP-seq normalized reads for H3K36me2,H3K36me3, DNMT3A2, and DNMT3B in mESCs at Chr12: 86.6-87.5 Mb. Refseq genes are annotated at the bottom. Shaded areas indicate H3K36me2-enriched intergenic regions (orange) and H3K36me3-enriched genic regions (green) in parental cells. For H3K36me2 and DNMT3A2, ChIP-seq was performed once and an independent ChIP was performed in which genomic regions of selective enrichment and depletion were confirmed by qPCR. H3K36me3 and DNMT3B ChIP-seq were performed once.
d) ChIP-seq normalized reads per 10kb bin for DNMT3A2 (y-axis) and DNMT3B (x-axis)in mESCs (n = 246,285). Each bin/dot was color-coded based on differences between H3K36me3 and H3K36me2 ChIP-seq reads to show selective enrichment for H3K36me2 (orange) or H3K36me3 (green).
e) De novo methylation per bin by DNMT3A2 (brown) or DNMT3B (grey) uponreintroduction into DNMT triple knockout mESCs relative to H3K36me3. To generate bins, 1kb genomic tiles (n = 2,462,755) were ranked by H3K36me3 enrichment in mESCs and grouped into 1000 rank-ordered bins (2,463 tiles per group). Dashed line indicates H3K36me3 enrichment per bin. Goodness of fit was computed on a quadratic model (red line).
For gel source data, see Supplementary Fig. 1.
Extended Data Figure 4: Genetic ablation of Nsd1/2 in mMSCs and Nsd1 in mESCs.
a) Immunoblots of lysates from parental and H3K36 methyltransferase knockout mMSCclonal lines for NSD1, NSD2, and SETD2. Vinculin was used as a loading control.
b) Immunoblots of lysates from parental and sgNsd1 mESCs expressing HA-taggedDNMT3A. sgNsd1 cells were rescued with ectopic expression of wildtype (WT) or catalytic mutant (C2023A) NSD1. Vinculin was used as a loading control.
c) Immunoblots of lysates generated from parental, sgSetd2, and sgNsd1/2 mMSCs forH3K36me3 and H3K36me2, with total H3 as a loading control.
d) Ratios of ChIP-seq reads for H3K36me2/3 in mMSCs between target chromatin (Mouse) and reference spike-in chromatin (Drosophila). Data are representative of two independent experiments.
e) Quantitative mass spectrometry measurement of the abundance of histone PTMs inacid-extracted histones derived from indicated mMSC lines from one experiment.
f) Ratios of ChIP-seq reads for H3K36me2/3 in mESCs between target chromatin(Mouse) and reference spike-in chromatin (Drosophila) from one experiment.
g) Density plots of H3K36me2 levels at intergenic (n = 1,165), exonic (n = 13,601), andintronic (n = 12,364) regions for parental (grey) and sgNsd1/2 (orange) mMSCs. Indicated p-values determined by Wilcoxon’s rank sum test (two-sided).
h) Density plots of H3K36me2 levels at intergenic (n = 1,165), exonic (n = 13,601), andintronic (n = 12,364) regions for parental (grey) and sgNsd1 (orange) mESCs. Indicated p-values determined by Wilcoxon’s rank sum test (two-sided).
The immunoblot data in a), b) and c) were independently repeated twice with similar results.
For gel source data, see Supplementary Fig. 1.
Extended Data Figure 5: H3K36me2 depletion impairs genomic targeting of DNMT3A and reduces intergenic CpG methylation.
a) Immunoblots of lysates from parental, sgSetd2 and sgNsd1/2 mMSCs ectopically expressing HA-DNMT3A1 or -DNMT3B. β-tubulin was used as a loading control.
b) Immunoblots of lysates from sgDnmt3a, parental, and sgNsd1 mESCs ectopically expressing HA-DNMT3A2 or -DNMT3B. Vinculin was used as a loading control.
c) Genome browser representation of ChIP-seq normalized reads for H3K36me3,H3K36me2, and DNMT3A1 in parental and sgNsd1/2 mMSCs at Chr17: 87.9-88.7 Mb, as indicated. Levels of CpG methylation are depicted as a heat map (blue/low; white/intermediate; red/high). Refseq genes are annotated at the bottom. Shaded area indicates H3K36me2-enriched intergenic region in parental cells. For H3K36me2, H3K36me3, and DNMT3A1 in parental cells, data are representative of two independent ChIP-seq experiments. DNMT3A1 ChIP-seq in sgNsd1/2 cells and WGBS in both lines were performed once.
d) Genome browser representation of ChIP-seq normalized reads for H3K36me3,H3K36me2, and DNMT3A2 in parental and sgNsd1 mESCs at Chr17: 87.9-88.7 Mb, as indicated. Levels of CpG methylation are depicted as a heat map (blue/low; white/intermediate; red/high). Refseq genes are annotated at the bottom. Shaded area indicates H3K36me2-enriched intergenic region in parental cells. For H3K36me2 and DNMT3A2, ChIP-seq was performed once and an independent ChIP was performed in which genomic regions of selective enrichment and depletion were confirmed by qPCR. WGBS and H3K36me3 ChIP-seq were performed once.
e) Percent change of averaged CpG methylation between parental and sgNsd1/2mMSCs was plotted relative to changes in ChIP-seq normalized reads of H3K36me2 for 100kb non-overlapping bins (n = 25,611). Pearson’s correlation coefficient is indicated.
f) Percent change of averaged CpG methylation between parental and sgNsd1 mESCswas plotted relative to changes in ChIP-seq normalized reads of H3K36me2 for 100kb non-overlapping bins (n= 26,044). Pearson’s correlation coefficient is indicated.
g) The enrichment (% input) of H3K36me2 at various intergenic regions in parental(black) and sgNsd1 (orange) mESCs rescued with ectopic expression of wild-type (WT) or C2023A catalytic mutant (Mut) NSD1 was measured with ChIP-qPCR. Each data point represents a genomic locus (n = 10 for H3K36me2-enriched regions, n = 4 for H3K36me2-depleted regions). Data are mean ± SD. Indicated p-values were determined by one-way ANOVA.
The immunoblot data in a) and b) were independently repeated twice with similar results.
For gel source data, see Supplementary Fig. 1.
Extended Data Figure 6: PWWP domain of DNMT3A preferentially binds to H3K36me2.
a) The dCypher approach to interrogate chromatin readers (see Methods). Biotinylatednucleosomes are immobilized on Streptavidin donor beads and GST-tagged DNMT3APWWP on glutathione AlphaLISA acceptor beads. Laser excitation of the donor generates singlet oxygen that diffuses to activate emission from the acceptor: fluorescence counts are directly proportional to the amount of donor-acceptor bridged by the nucleosome-reader interaction.
b) Quantification of AlphaLISA counts for isolated GST-DNMT3APWWP interaction titratedagainst H3K36-modified nucleosomes (me0/me1/me2/me3) from mean of two replicates.
c) ITC titration and fitting curves of human DNMT3A PWWP domain with H3.3(1-42)K36-modified peptides (me0/me1/me2/me3).
d) ITC titration and fitting curves of human DNMT3A PWWP domain with H3.1(1-42)K36-modified peptides (me0/me1/me2/me3) .
Extended Data Figure 7: Redistribution of DNMT3A to H3K36me3-marked gene bodies upon loss of H3K36me2.
a) Averaged ChIP-seq normalized signal across all gene bodies represented as log2fold change over input for DNMT3A1 (grey, n = 14,959) and DNMT3B (green, n = 14,959) in parental mMSCs, and for DNMT3A1 (orange, n = 14,311) in sgNsd1/2 mMSCs.
b) Quantification of ChIP-seq normalized reads of DNMT3A1 in parental, sgNsd1/2, andTKO mMSCs at 10kb non-overlapping bins enriched for H3K36me3 in parental cells (top 20% of bins, n = 54,624). Reads were normalized by read depth. P-values were < 2.2 × 10⁻¹⁶ for all pair-wise comparisons as determined by Wilcoxon’s rank sum test (two-sided). Boxes represent median and 25th-75th percentiles, whiskers are minimum to maximum with discrete points representing outliers.
c) Genome browser representation of ChIP-seq normalized reads for H3K36me2,H3K36me3, and DNMT3A1 in parental, sgNsd1/2, and TKO mMSCs at Chr10: 74.8-77.8 Mb, as indicated. Refseq genes are annotated at the bottom. Shaded areas indicate H3K36me3-enriched genic regions in parental cells. For H3K36me2 and H3K36me3, data in parental and sgNsd1/2 cells are representative of two independent ChIP-seq experiments. ChIP-seq in TKO cells for H3K36me2 and H3K36me3 were performed once. For DNMT3A1, data in parental cells is representative of two independent ChIP-seq experiments. ChIP-seq in sgNsd1/2 and TKO cells for DNMT3A1 was performed once.
d) Immunoblots of lysates from parental, sgNsd1/2, and TKO mMSCs ectopically expressing HA-tagged wildtype (WT) or D333A mutant DNMT3A1. β-actin was used as a loading control. Data are representative of two independent experiments.
e) Fold enrichment of wildtype (WT) or PWWP-mutated (D333A) DNMT3A1 at genebody versus intergenic regions in parental (black) and sgNsd1/2 (orange) mMSCs was measured with ChIP-qPCR. Each data point represents a genomic locus (n = 10). Data are mean ± SD. Indicated p-values determined by one-way ANOVA.
For gel source data, see Supplementary Fig. 1.
Extended Data Figure 8: Assessment of binding affinity between DNMT3B and H3K36me2 in vitro and in cells.
a) Immunoblots of His/MBP-tagged recombinant PWWP domains of DNMT3A and DNMT3B.
b) Immunoblots of recombinant His/MBP-tagged wild-type DNMT3A and DNMT3BPWWP domains bound to H3K36-modified recombinant nucleosomes following the in vitro pull-down assay.
c) ChIP-seq normalized reads per bin for DNMT3A1 (grey) and DNMT3B (blue) inparental mMSCs and DNMT3B (red) in sgSetd2 mMSCs relative to H3K36me2. To generate bins, 1kb genomic tiles were ranked by H3K36me2 enrichment in parental mMSCs and grouped into 1000 rank-ordered bins. Dashed line indicates H3K36me2 enrichment per bin.
d) Genome browser representation of ChIP-seq normalized reads for H3K36me2,H3K36me3, and DNMT3B in parental and sgSetd2 mMSCs at Chr10: 83.4-84.3 Mb, as indicated. Refseq genes are annotated at the bottom. Shaded areas indicate H3K36me2-enriched intergenic regions (orange) and H3K36me3-enriched genic regions (green) in parental cells. For H3K36me2 and H3K36me3, data are representative of two independent ChIP-seq experiments; for DNMT3B, ChIP-seq was performed once and an independent ChIP was performed in which genomic regions of selective enrichment and depletion were confirmed by qPCR.
The immunoblot data in a) and b) were independently repeated twice with similar results.
For gel source data, see Supplementary Fig. 1.
Extended Data Figure 9: TBRS-associated DNMT3A mutations are loss-of-function and result in Sotos syndrome-like DNA hypomethylation.
a) Immunoblots of recombinant His/MBP-tagged DNMT3A PWWP domain containingTBRS-associated mutations. MBP alone was used as a control.
b) Immunoblots of soluble or chromatin-associated lysates generated from cellsectopically expressing HA-tagged wildtype (WT), or mutant (W297del or I310N) DNMT3A. β-tubulin and LaminB1 were used as loading controls for the soluble and chromatin-associated fractions, respectively.
c) Immunoblots of lysates from parental mMSCs ectopically expressing HA-taggedwildtype (WT) or TBRS-mutant DNMT3A from one experiment. β-tubulin was used as a loading control.
d) Immunoblots of nucleosomes bound to HA-tagged wildtype (WT) or mutant(W297del, I310N, or Y365C) DNMT3A after ChIP with anti-HA tag antibodies. Total H3 was used as a loading control and to normalize for differences in protein expression and nucleosome pull-down efficiency between samples.
e) Genome browser representation of ChIP-seq normalized reads for H3K36me2,DNMT3A1 wildtype (WT), and DNMT3A1 I310N mutant in mMSCs at Chr13: 62.2-66.8 Mb. Levels of CpG methylation are depicted as a heat map (blue/low; white/intermediate; red/high). Refseq genes are annotated at the bottom.
f) ChIP-seq normalized reads of DNMT3A1 wild-type or PWWP mutant (I310N) wereplotted relative to that of H3K36me2 for 100kb non-overlapping bins (WT: n = 25,694; I310N: n = 25,757). Pearson’s correlation coefficient is indicated. For H3K36me2 and DNMT3A1 WT, data are representative of two independent ChIP-seq experiments; for DNMT3A1 I310N, ChIP-seq was performed once and an independent ChIP was performed in which genomic regions of selective enrichment and depletion were confirmed by qPCR. WGBS was performed once.
g) Unsupervised hierarchical clustering of publically available Infinium HumanMethylation 450K array profiles of blood samples from TBRS, Sotos and Weaver syndrome patients and controls, based on top 1000 most variable probes.
h) Model depicting chromatin landscape changes in Sotos and Tatton-Brown-Rahman(TBRS) human developmental overgrowth syndromes. In normal development, DNMT3A and DNMT3B act in parallel to methylate CpG dinucleotides at H3K36me2-enriched intergenic and H3K36me3-enriched genic regions, respectively. Haploinsufficiency of NSD1 and depletion of intergenic H3K36me2 levels in Sotos syndrome abrogates PWWP-mediated intergenic recruitment of DNMT3A, leading to intergenic DNA hypomethylation and DNMT3A redistribution to H3K36me3-enriched gene bodies. Mutations within the PWWP domain of DNMT3A in TBRS impair chromatin occupancy and reduce cellular levels of the protein, thereby also resulting in intergenic DNA hypomethylation.
The immunoblot data in a), c), and d) were independently repeated twice with similar results.
For gel source data, see Supplementary Fig. 1.
Supplementary Material
Acknowledgements
We thank Tim Bestor and members of the Lu, Majewski and Allis laboratories for critical reading of the manuscript. This research was supported by US National Institutes of Health (NIH) grants (P01CA196539 to N.J., B.A.G., C.D.A., and J.M.; R00CA212257 to C.L.; T32GM007739 and F30CA224971 to D.N.W.; T32GM008275 to D.M.M.; R44GM116584 and R44GM117683 to M.-C.K.), the Rockefeller University (C.D.A.) and the Cedars Cancer Foundation (N.J.). This research was funded in part through the NIH/NCI Cancer Center Support Grant P30CA013696 and used the HICCC Flow Cytometry Shared Resource. B.A.G. is funded by a Leukemia and Lymphoma Society Dr. Robert Arceci Scholar Award. H.L. is funded by the National Natural Science Foundation of China (31725014 and 91753203). This work was performed within the context of the I-CHANGE consortium and supported by funding from Genome Canada, Genome Quebec, the Institute for Cancer Research of the CIHR, McGill University and the Montreal Children’s Hospital Foundation. C.L. is the Giannandrea Family Dale F. Frey Breakthrough Scientist of the Damon Runyon Foundation (DFS-28-18), a Pew-Stewart Scholar for Cancer Research and supported by AACR Gertrude B. Elion Cancer Research Grant. N.J. is a member of the Penny Cole Laboratory and the recipient of a Chercheur Boursier, Chaire de Recherche Award from the Fond de la Recherche du Québec en Santé. S.P.-C. and A.S.H. are supported by a studentship and postdoctoral fellowship from the Fond de la Recherche du Québec en Santé, respectively.
Footnotes
The authors declare competing financial interests. EpiCypher is a commercial developer and supplier of platforms similar to those used in this study: recombinant semi-synthetic modified nucleosomes and the dCypher nucleosome binding assay. H.C. and Y.Y. contributed equally as co-second authors to this manuscript.
References
- 1.Li E, Bestor TH & Jaenisch R Targeted mutation of the DNA methyltransferase gene results in embryonic lethality. Cell 69, 915–926 (1992). [DOI] [PubMed] [Google Scholar]
- 2.Okano M, Bell DW, Haber DA & Li E DNA methyltransferases Dnmt3a and Dnmt3b are essential for de novo methylation and mammalian development. Cell 99, 247–257 (1999). [DOI] [PubMed] [Google Scholar]
- 3.Wu H et al. Dnmt3a-Dependent Nonpromoter DNA Methylation Facilitates Transcription of Neurogenic Genes. Science 329, 444–448 (2010). [DOI] [PMC free article] [PubMed] [Google Scholar]
- 4.Challen GA et al. Dnmt3a is essential for hematopoietic stem cell differentiation. Nat. Genet 44, 23–31 (2011). [DOI] [PMC free article] [PubMed] [Google Scholar]
- 5.Ley TJ et al. DNMT3A mutations in acute myeloid leukemia. N. Engl. J. Med 363, 2424–2433 (2010). [DOI] [PMC free article] [PubMed] [Google Scholar]
- 6.Klein CJ et al. Mutations in DNMT1 cause hereditary sensory neuropathy with dementia and hearing loss. Nat. Genet 43, 595–600 (2011). [DOI] [PMC free article] [PubMed] [Google Scholar]
- 7.Xu GL et al. Chromosome instability and immunodeficiency syndrome caused by mutations in a DNA methyltransferase gene. Nature 402, 187–191 (1999). [DOI] [PubMed] [Google Scholar]
- 8.Tatton-Brown K et al. Mutations in the DNA methyltransferase gene DNMT3A cause an overgrowth syndrome with intellectual disability. Nat. Genet 46, 385–388 (2014). [DOI] [PMC free article] [PubMed] [Google Scholar]
- 9.Ooi SKT et al. DNMT3L connects unmethylated lysine 4 of histone H3 to de novo methylation of DNA. Nature 448, 714–717 (2007). [DOI] [PMC free article] [PubMed] [Google Scholar]
- 10.Baubec T et al. Genomic profiling of DNA methyltransferases reveals a role for DNMT3B in genic methylation. Nature 520, 243–247 (2015). [DOI] [PubMed] [Google Scholar]
- 11.Morselli M et al. In vivo targeting of de novo DNA methylation by histone modifications in yeast and mouse. eLife 4, (2015). [DOI] [PMC free article] [PubMed] [Google Scholar]
- 12.Kurotaki N et al. Haploinsufficiency of NSD1 causes Sotos syndrome. Nat. Genet 30, 365–366 (2002). [DOI] [PubMed] [Google Scholar]
- 13.Rayasam GV et al. NSD1 is essential for early post-implantation development and has a catalytically active SET domain. EMBO J. 22, 3153–3163 (2003). [DOI] [PMC free article] [PubMed] [Google Scholar]
- 14.Rao B, Shibata Y, Strahl BD & Lieb JD Dimethylation of Histone H3 at Lysine 36 Demarcates Regulatory and Nonregulatory Chromatin Genome-Wide. Molecular and Cellular Biology 25, 9447–9459 (2005). [DOI] [PMC free article] [PubMed] [Google Scholar]
- 15.Xiao T et al. Phosphorylation of RNA polymerase II CTD regulates H3 methylation in yeast. Genes Dev. 17, 654–663 (2003). [DOI] [PMC free article] [PubMed] [Google Scholar]
- 16.Doynova MD, Markworth JF, Cameron-Smith D, Vickers MH & O’Sullivan JM Linkages between changes in the 3D organization of the genome and transcription during myotube differentiation in vitro. Skelet Muscle 7, 5 (2017). [DOI] [PMC free article] [PubMed] [Google Scholar]
- 17.Kuo AJ et al. NSD2 links dimethylation of histone H3 at lysine 36 to oncogenic programming. Mol. Cell 44, 609–620 (2011). [DOI] [PMC free article] [PubMed] [Google Scholar]
- 18.Orlando DA et al. Quantitative ChIP-Seq Normalization Reveals Global Modulation of the Epigenome. Cell Reports 9, 1163–1170 (2014). [DOI] [PubMed] [Google Scholar]
- 19.Dhayalan A et al. The Dnmt3a PWWP Domain Reads Histone 3 Lysine 36 Trimethylation and Guides DNA Methylation. J. Biol. Chem 285, 26114–26120 (2010). [DOI] [PMC free article] [PubMed] [Google Scholar]
- 20.Papillon-Cavanagh S et al. Impaired H3K36 methylation defines a subset of head and neck squamous cell carcinomas. Nat. Genet 49, 180–185 (2017). [DOI] [PMC free article] [PubMed] [Google Scholar]
- 21.Choufani S et al. NSD1 mutations generate a genome-wide DNA methylation signature. Nat. Commu 6, 10207 (2015). [DOI] [PMC free article] [PubMed] [Google Scholar]
- 22.Tatton-Brown K et al. Mutations in Epigenetic Regulation Genes Are a Major Cause of Overgrowth with Intellectual Disability. The American Journal of Human Genetics 100, 725–736 (2017). [DOI] [PMC free article] [PubMed] [Google Scholar]
- 23.Heyn P et al. Gain-of-function DNMT3A mutations cause microcephalic dwarfism and hypermethylation of Polycomb-regulated regions. Nature Genetics 51, 96 (2019). [DOI] [PMC free article] [PubMed] [Google Scholar]
- 24.Jeffries AR et al. Growth disrupting mutations in epigenetic regulatory molecules are associated with abnormalities of epigenetic aging. Genome Res. (2019). doi: 10.1101/gr.243584.118 [DOI] [PMC free article] [PubMed] [Google Scholar]
- 25.Williams K, Christensen J & Helin K DNA methylation: TET proteins—guardians of CpG islands? EMBO reports 13, 28–35 (2011). [DOI] [PMC free article] [PubMed] [Google Scholar]
- 26.Boulard M, Edwards JR & Bestor TH FBXL10 protects Polycomb-bound genes from hypermethylation. Nat. Genet 47, 479–485 (2015). [DOI] [PubMed] [Google Scholar]
- 27.Quintana RM et al. A transposon-based analysis of gene mutations related to skin cancer development. J. Invest. Dermatol 133, 239–248 (2013). [DOI] [PubMed] [Google Scholar]
- 28.Rinaldi L et al. Loss of Dnmt3a and Dnmt3b does not affect epidermal homeostasis but promotes squamous transformation through PPAR-γ. Elife 6, (2017). [DOI] [PMC free article] [PubMed] [Google Scholar]
- 29.Jaju RJ et al. A novel gene, NSD1, is fused to NUP98 in the t(5;11)(q35;p15.5) in de novo childhood acute myeloid leukemia. Blood 98, 1264–1267 (2001). [DOI] [PubMed] [Google Scholar]
- 30.Sendžikaitė G, Hanna CW, Stewart-Morgan KR, Ivanova E & Kelsey G A DNMT3A PWWP mutation leads to methylation of bivalent chromatin and growth retardation in mice. Nature Communications 10, 1884 (2019). [DOI] [PMC free article] [PubMed] [Google Scholar]
Methods References
- 31.Sidoli S, Bhanu NV, Karch KR, Wang X & Garcia BA Complete Workflow for Analysis of Histone Post-translational Modifications Using Bottom-up Mass Spectrometry: From Histone Extraction to Data Analysis. J Vis Exp. 111, e54112 (2016). [DOI] [PMC free article] [PubMed] [Google Scholar]
- 32.Yuan ZF et al. EpiProfile 2.0: A Computational Platform for Processing Epi-Proteomics Mass Spectrometry Data. J Proteome Res. 17, 2533–2541 (2018). [DOI] [PMC free article] [PubMed] [Google Scholar]
- 33.Li H & Durbin R Fast and accurate short read alignment with Burrows-Wheeler transform. Bioinformatics 25, 1754–1760 (2009). [DOI] [PMC free article] [PubMed] [Google Scholar]
- 34.Quinlan AR & Hall IM BEDTools : a flexible suite of utilities for comparing genomic features. Bioinformatics 26, 841–842 (2010). [DOI] [PMC free article] [PubMed] [Google Scholar]
- 35.Robinson JT et al. Integrative genomics viewer. Nature Biotechnology 29, 24–26 (2011). [DOI] [PMC free article] [PubMed] [Google Scholar]
- 36.Thorvaldsdottir H, Robinson JT & Mesirov JP Integrative Genomics Viewer (IGV) : high-performance genomics data visualization and exploration. Brief. Bioinformatics 14, 178–192 (2013). [DOI] [PMC free article] [PubMed] [Google Scholar]
- 37.Killick R et al. Optimal detection of changepoints with a linear computation cost. J Am Stat Assoc 107, 1590–1598 (2012). [Google Scholar]
- 38.Wambui GD et al. The Power of the Pruned Exact Linear Time (PELT) Test in Multiple Changepoint Detection. American Journal of Theoretical and Applied Statistics 4, 581–586 (2015). [Google Scholar]
- 39.Shen L, Shao N, Liu X & Nestler E ngs.plot: Quick mining and visualization of next-generation sequencing data by integrating genomic databases. BMC Genomics 15, 284 (2014). [DOI] [PMC free article] [PubMed] [Google Scholar]
- 40.Liao Y, Smyth GK, & Shi W featureCounts: an efficient general purpose program for assigning sequence reads to genomic features. Bioinformatics 30, 923–930 (2014). [DOI] [PubMed] [Google Scholar]
- 41.Dobin A et al. STAR : ultrafast universal RNA-seq aligner. Bioinformatics 29, 15–21 (2013). [DOI] [PMC free article] [PubMed] [Google Scholar]
- 42.Li H et al. The Sequence Alignment/Map format and SAMtools. Bioinformatics 25, 2078–2079 (2009). [DOI] [PMC free article] [PubMed] [Google Scholar]
- 43.Consortium EP An integrated encyclopedia of DNA elements in the human genome. Nature 489, 57–74 (2012). [DOI] [PMC free article] [PubMed] [Google Scholar]
- 44.Hovestadt V et al. Decoding the regulatory landscape of medulloblastoma using DNA methylation sequencing. Nature 510, 537–541 (2014). [DOI] [PubMed] [Google Scholar]
- 45.Berman BP et al. Regions of focal DNA hypermethylation and long-range hypomethylation in colorectal cancer coincide with nuclear lamina-associated domains. Nat. Genet. 44, 40–46 (2012). [DOI] [PMC free article] [PubMed] [Google Scholar]
Associated Data
This section collects any data citations, data availability statements, or supplementary materials included in this article.
Supplementary Materials
Data Availability Statement
The WGBS, ChIP-seq, and RNA-seq data have been deposited in the Gene Expression Omnibus (GEO) database under accession number GSE118785.


