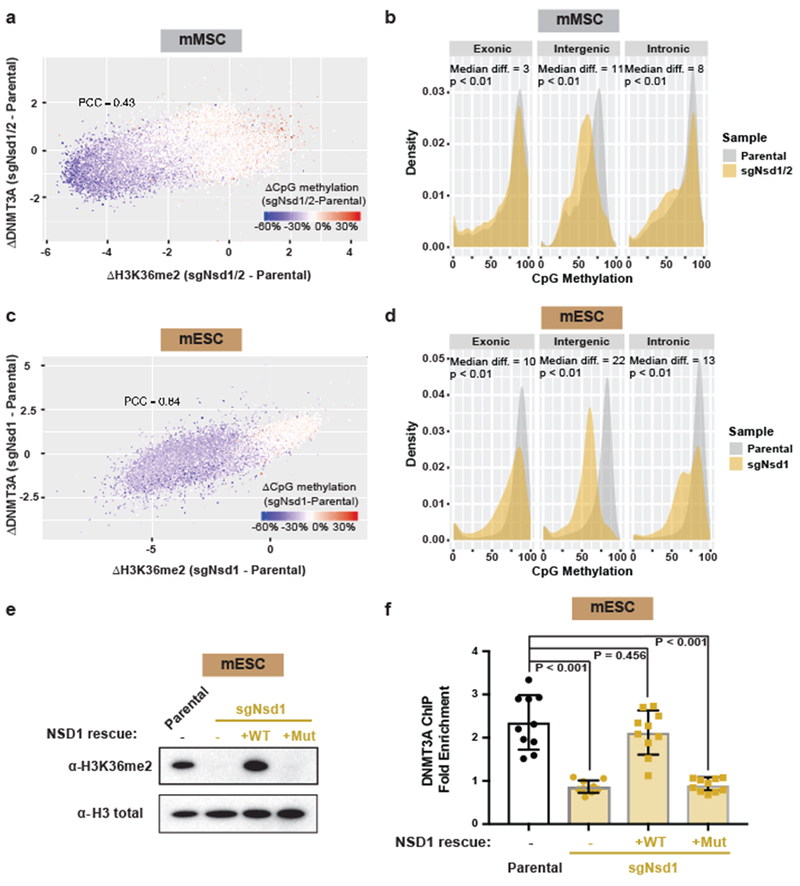
Figure 2: NSD1-mediated H3K36me2 is required for intergenic DNMT3A localization and CpG methylation.

a) Difference in ChIP-seq normalized reads of DNMT3A1 between parental and sgNsd1/2 mMSCs was plotted relative to that of H3K36me2 for 10kb non-overlapping bins (n = 246,285). Each bin/dot was color-coded based on change of averaged CpG methylation to show lost (blue) or gained (red) CpG methylation in sgNsd1/2 cells. Pearson’s correlation coefficient is indicated.
b) Histograms for CpG methylation at intergenic (n = 1,165), exonic (n = 13,601), and intronic (n = 12,364) regions for parental (grey) and sgNsd1/2 (orange) mMSCs. Indicated p-values determined by Wilcoxon’s rank sum test (two-sided).
c) Difference in ChIP-seq normalized reads of DNMT3A2 between parental and sgNsd1 mESCs was plotted relative to that of H3K36me2 for 10kb non-overlapping bins (n = 246,285). Each bin/dot was color-coded based on change of averaged CpG methylation to show lost (blue) or gained (red) CpG methylation in sgNsd1 cells. Pearson’s correlation coefficient is indicated.
d) Histograms for CpG methylation at intergenic (n = 1,165), exonic (n = 13,601), and intronic (n = 12,364) regions for parental (grey) and sgNsd1 (orange) mESCs. Indicated p-values determined by Wilcoxon’s rank sum test (two-sided).
e) Immunoblots of lysates generated from parental and sgNsd1 mESCs for H3K36me2, with total H3 as a loading control. sgNsd1 cells were rescued with ectopic expression of wild-type (WT) or C2023A catalytic mutant (Mut) NSD1. Data are representative of two independent experiments.
f) Fold enrichment of DNMT3A at various H3K36me2-enriched versus H3K36me2-depleted intergenic regions in parental (black) and sgNsd1 (orange) mESCs rescued with ectopic expression of wild-type (WT) or C2023A catalytic mutant (Mut) NSD1 was measured with ChIP-qPCR. Each data point represents a genomic locus (n = 10). Data are mean ± SD. Indicated p-values determined by one-way ANOVA.
For gel source data, see Supplementary Fig. 1.
