
Figure 3: Preferential recognition of H3K36me2/3 by PWWP-domain of DNMT3A facilitates its localization.
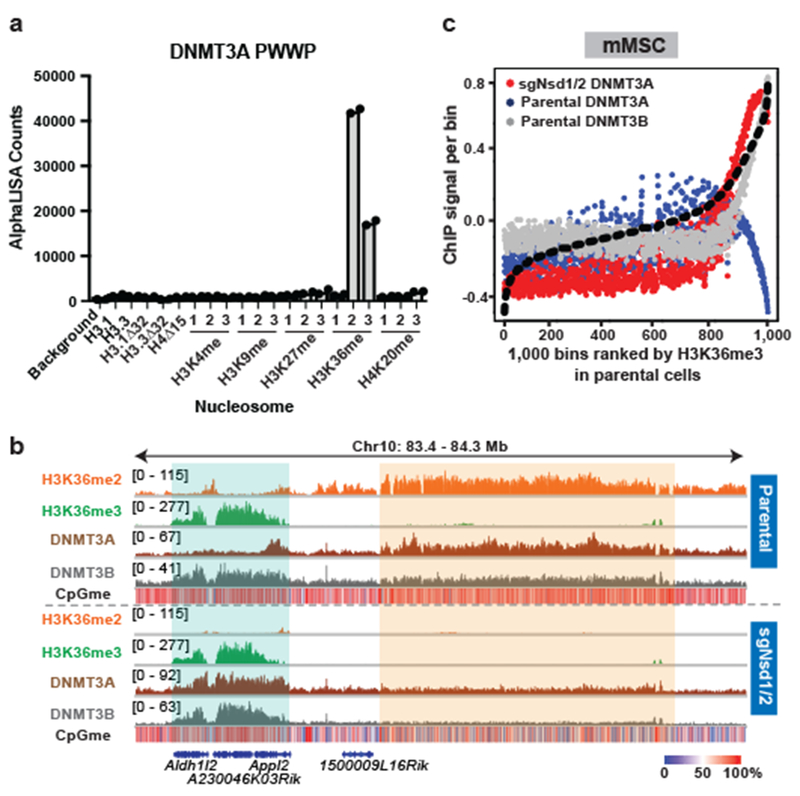
a) AlphaLISA counts for GST-DNMT3APWWP interaction with semi-synthetic modified nucleosomes from two replicates.
b) Genome browser representation of ChIP-seq normalized reads for H3K36me2, H3K36me3, DNMT3A1, and DNMT3B in parental and sgNsd1/2 mMSCs at Chr10: 83.4-84.3 Mb. Levels of CpG methylation are depicted as a heat map (blue/low; white/intermediate; red/high). Refseq genes are annotated at the bottom. Shaded areas indicate H3K36me2-enriched intergenic regions (orange) and H3K36me3-enriched genic regions (green) in parental cells. Upon H3K36me2 depletion, DNMT3A is re-targeted to H3K36me3-enriched gene bodies (eg. Aldh1/2 and Appl2). For H3K36me2, H3K36me3, and DNMT3A1 in parental cells, data are representative of two independent ChIP-seq experiments. For DNMT3B in parental cells, ChIP-seq was performed once and an independent ChIP was performed in which genomic regions of selective enrichment and depletion were confirmed by qPCR. DNMT3A1 and DNMT3B ChIP-seq in sgNsd1/2 cells and WGBS in both lines were performed once.
c) ChIP-seq normalized reads per bin for DNMT3A1 (blue) and DNMT3B (grey) in parental mMSCs and DNMT3A1 (red) in sgNsd1/2 mMSCs relative to H3K36me3. To generate bins, 1kb genomic tiles (n = 2,462,755) were ranked by H3K36me3 enrichment in mMSCs and grouped into 1000 rank-ordered bins (2,463 tiles per group). Dashed line indicates H3K36me3 enrichment per bin.