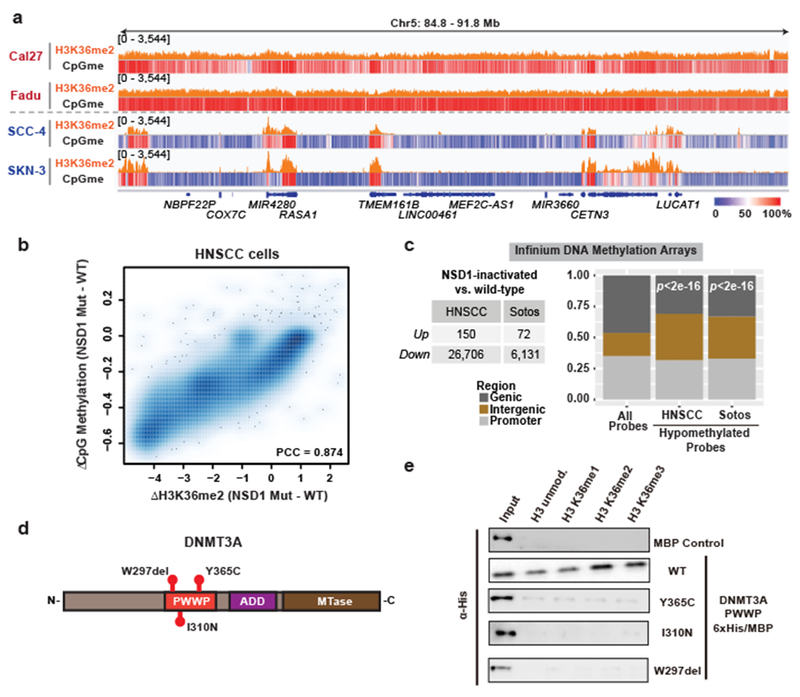
Figure 4: Impaired intergenic DNMT3A localization and CpG methylation in neoplastic and developmental overgrowth.

a) Genome browser representation of ChIP-seq normalized reads for H3K36me2 in NSD1 wild-type (Cal27, Fadu) and NSD1 mutant (SCC-4, SKN-3) HNSCC cell lines at Chr5: 84.8-91.8 Mb. Levels of CpG methylation are depicted as a heat map (blue/low; white/intermediate; red/high). Refseq genes are annotated at the bottom. For H3K36me2 in Fadu and SKN-3 lines, data are representative of two independent ChIP-seq experiments. H3K36me2 ChIP-seq in Cal27 and SCC-4 lines and WGBS in all lines were performed once.
b) Percent changes of averaged CpG methylation between NSD1 wildtype and mutant HNSCC cell lines were plotted relative to changes in ChIP-seq normalized reads of H3K36me2 for 100kb non-overlapping bins (n = 28,395). Pearson’s correlation coefficient is indicated.
c) Left, table summarizing number of up- and down-regulated Infinium 450K DNA methylation array probes between NSD1 inactivated vs. NSD1 wild-type HNSCC tumor samples, and Sotos vs. control patient samples. Right, bar graph showing intergenic enrichment of DNA hypomethylated probes relative to all probes (n = 370,898). Indicated p-values determined by chi-squared test.
d) Schematic of DNMT3A conserved structural domains with indicated TBRS-associated mutations.
e) Immunoblots of recombinant His/MBP-tagged DNMT3A wild-type and mutant PWWP domains (Y365C, I310N, and W297del) bound to H3K36-modified recombinant nucleosomes following the in vitro pull-down assay. Data are representative of two independent experiments.
For gel source data, see Supplementary Fig. 1.
