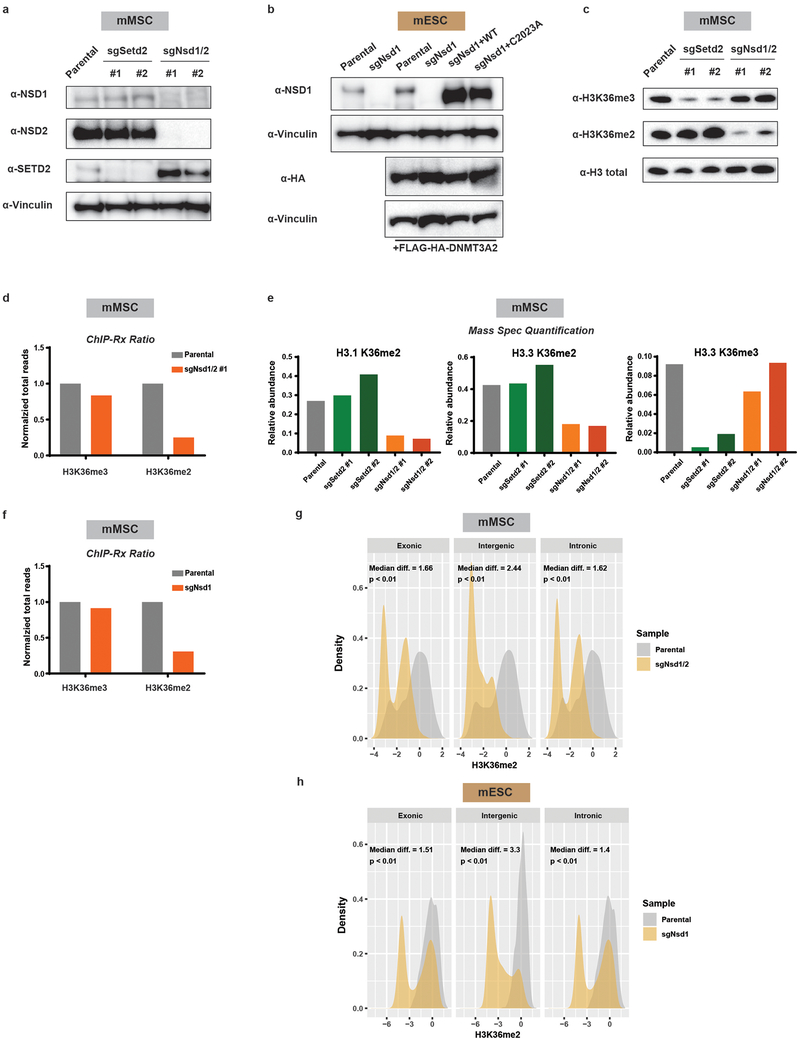
Extended Data Figure 4: Genetic ablation of Nsd1/2 in mMSCs and Nsd1 in mESCs.
a) Immunoblots of lysates from parental and H3K36 methyltransferase knockout mMSCclonal lines for NSD1, NSD2, and SETD2. Vinculin was used as a loading control.
b) Immunoblots of lysates from parental and sgNsd1 mESCs expressing HA-taggedDNMT3A. sgNsd1 cells were rescued with ectopic expression of wildtype (WT) or catalytic mutant (C2023A) NSD1. Vinculin was used as a loading control.
c) Immunoblots of lysates generated from parental, sgSetd2, and sgNsd1/2 mMSCs forH3K36me3 and H3K36me2, with total H3 as a loading control.
d) Ratios of ChIP-seq reads for H3K36me2/3 in mMSCs between target chromatin (Mouse) and reference spike-in chromatin (Drosophila). Data are representative of two independent experiments.
e) Quantitative mass spectrometry measurement of the abundance of histone PTMs inacid-extracted histones derived from indicated mMSC lines from one experiment.
f) Ratios of ChIP-seq reads for H3K36me2/3 in mESCs between target chromatin(Mouse) and reference spike-in chromatin (Drosophila) from one experiment.
g) Density plots of H3K36me2 levels at intergenic (n = 1,165), exonic (n = 13,601), andintronic (n = 12,364) regions for parental (grey) and sgNsd1/2 (orange) mMSCs. Indicated p-values determined by Wilcoxon’s rank sum test (two-sided).
h) Density plots of H3K36me2 levels at intergenic (n = 1,165), exonic (n = 13,601), andintronic (n = 12,364) regions for parental (grey) and sgNsd1 (orange) mESCs. Indicated p-values determined by Wilcoxon’s rank sum test (two-sided).
The immunoblot data in a), b) and c) were independently repeated twice with similar results.
For gel source data, see Supplementary Fig. 1.

