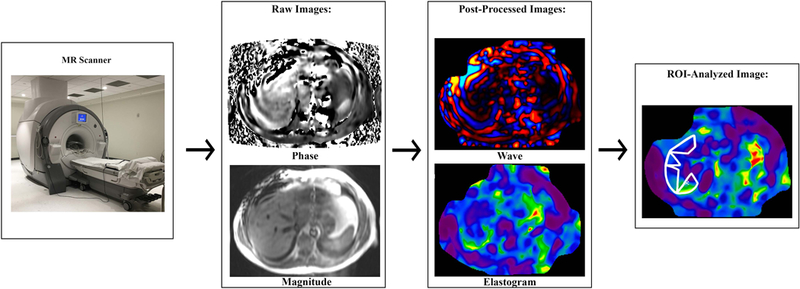
Figure 5.

MR elastography involves several steps. A driver system generates and transmits longitudinal waves into the patient. Some of the wave energy is converted into shear waves via “mode conversion” (not shown). A phase-contrast pulse sequence with motion-encoding gradients images the shear waves at several (typically three or four) “phase offsets” to capture different phases of the wave cycle; one phase cycle is shown. Four or more slices are usually acquired; one slice is shown. Raw phase and magnitude images are generated. Post-processing produces wave images and colorized magnitude-of-complex-shear-modulus (“shear stiffness”) maps known as elastograms for each acquired slice. An analyst places a region of interest on each elastogram. A mean “shear stiffness” value in units of kPa is calculated from all pixels contained in all ROIs in all slices.
