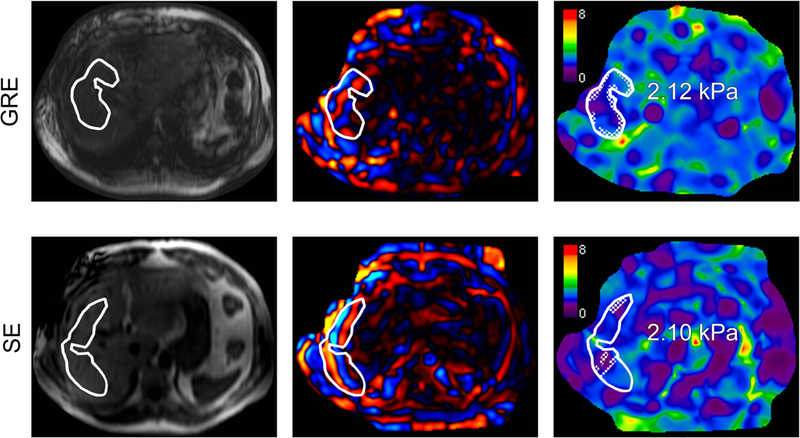
Figure 6.

MR elastography performed on a 3T GE 750 scanner by using a two-dimensional (2D) gradient-recalled echo (GRE) sequence (top row) and a 2D spin-echo-based echo planar imaging (SE-EPI) sequence (bottom row) in a 54-year-old man with nonalcoholic fatty liver disease (NAFLD) and fibrosis stage 0 on histology (Brunt system). Shown from left to right for each sequence: magnitude image, transverse colorized wave image, and transverse colorized elastogram. Using magnitude images as reference, regions of interest (ROIs) are drawn over the right liver lobe by an analyst on the wave images. Areas with poor wave propagation, blood vessels, and inhomogeneous liver parenchyma are avoided. The ROIs are propagated to the elastograms for mean “shear stiffness” estimates (kPa). An automated 95% confidence grid, appearing as a cross-hatched pattern within the ROIs, is placed over areas of unreliable data that do not contribute to the mean stiffness estimates on the elastograms.
