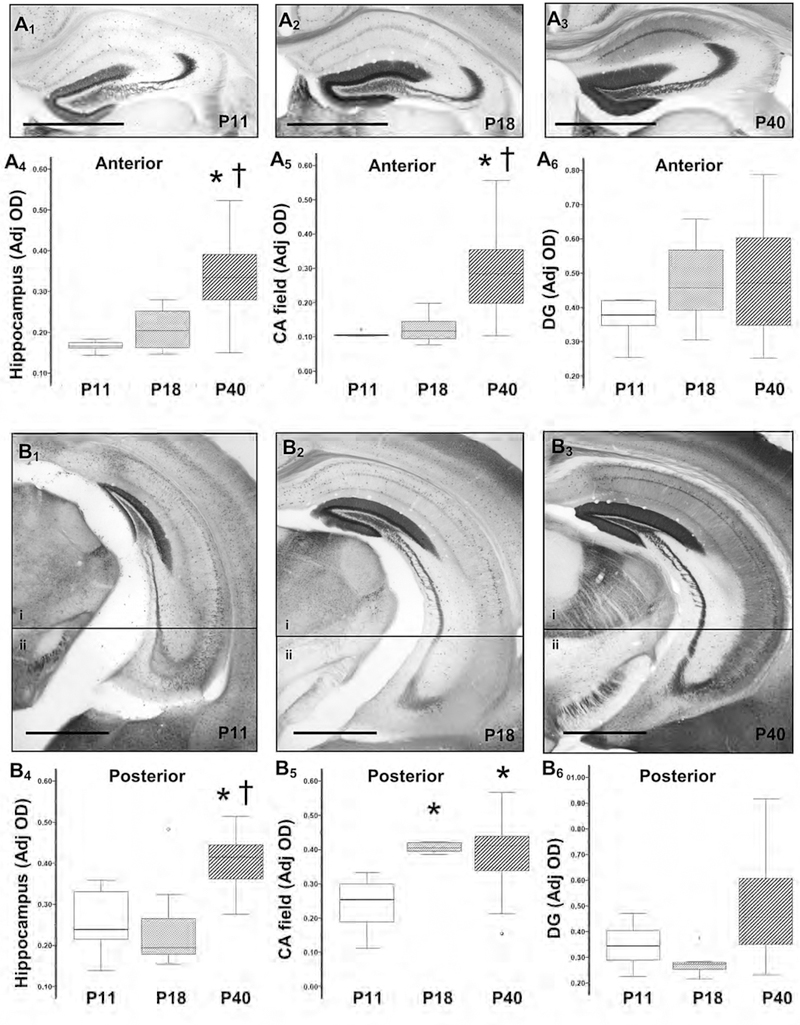
Figure 1. Developmental changes in Calb1 expression in the hippocampus.
Representative Calb1 IHC of hippocampal sections in anterior (A1 to A3) and posterior (B1 to B3) coronal sections at P11 (A1 and B1), P18 (A2 and B2), and P40 (A3 and B3). Bar, 1000 μm. Two photomicrographs (4X) of the hippocampus in the posterior coronal section (i and ii), were used to compose the final figure (B1 to B3). Box and whiskers plot represent mean optical densities (OD) adjusted for background for Calb1 immunoreactivity in anterior and posterior coronal brain sections for the whole hippocampus (A4 and B4, respectively), the CA field (A5 and B5, respectively), and DG (A6 and B6, respectively). Boxes are limited by the 75th and 25th percentiles (interquartile range, IQR) and whiskers are limited by the last data point within 1.5 times the IQR from the median (continuous line inside the box). Analysis by Kruskal-Wallis ANOVA with Dunn-Bonferroni correction; *, adjusted p value <0.05. CA, cornus ammonis; DG, dentate gyrus.

