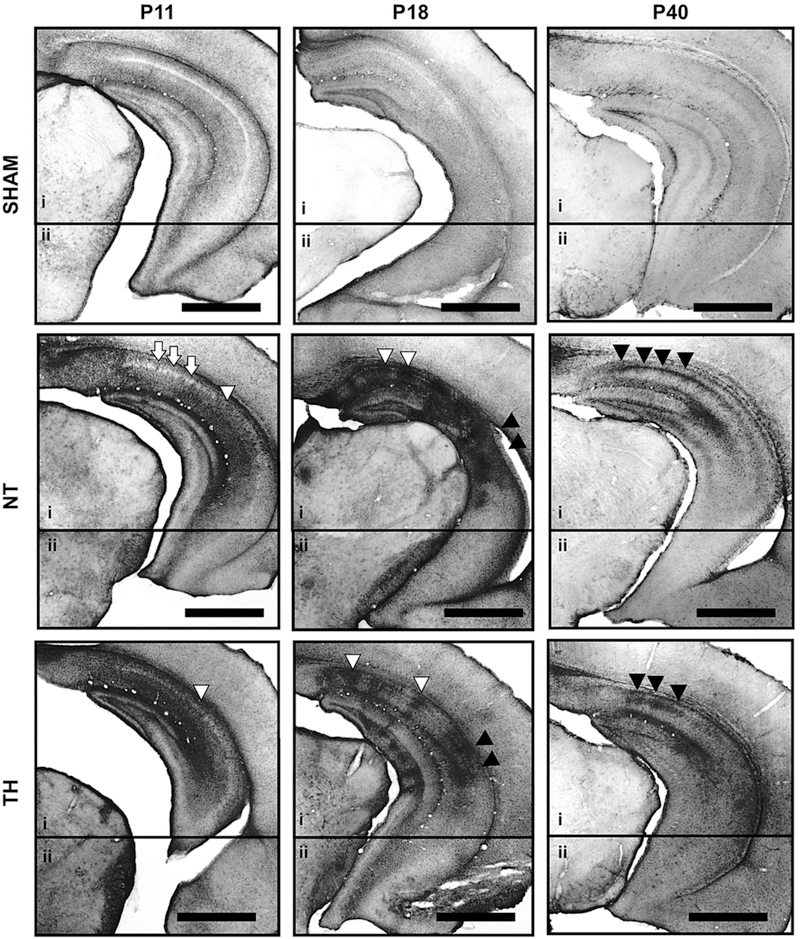
Figure 4. Temporal evolution of GFAP immunoreactivity between P11 to P40 in sham and HI-injure mice treated with NT or TH.
Representative GFAP IHC of posterior brain sections containing hippocampi of sham, normothermia (NT), and therapeutic hypothermia (TH). Bar, 1000 μm. Two photomicrographs (4X) of the hippocampus (i and ii) within the posterior coronal section, were used to compose final figure. White arrows, areas of columnar injury or cellular loss within the CA pyramidal cell layer (Py). White arrow heads, glial scars with the CA Py. Black arrow heads, area of diffuse astrogliosis with the CA Py.

