Fig. 4.
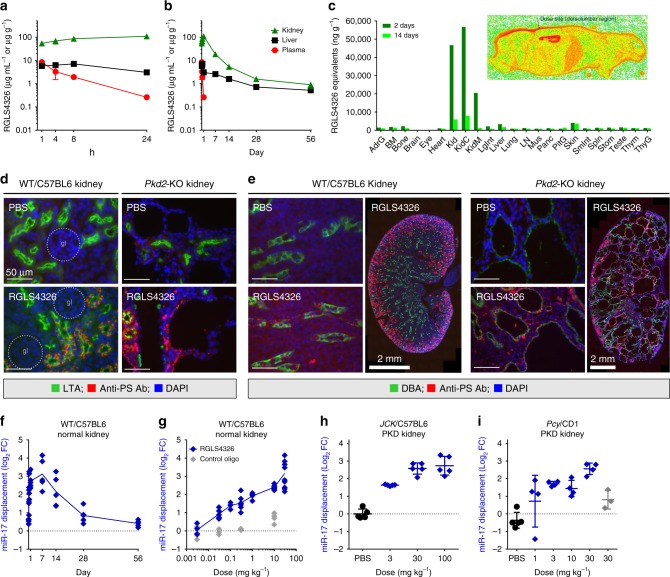
Pharmacokinetic, tissue distribution and pharmacodynamic profile of RGLS4326. a–b Kidney (green triangle), liver (black square) and plasma (red circle) exposures-vs.-time profiles of RGLS4326 following a single 30 mg kg−1 SC dose in WT/C57BL6 mice (n = 5/group). c Tissue distribution profile of RGLS4326 showing preferential kidney distribution based on quantitative whole-body autoradiography of [35S]-RGLS4326-derived radioactivity in male WT/CD1 mice 2 days (dark green) and 14 days (light green) after a single SC dose of RGLS4326 at 30 mg kg−1 and target radioactivity of 100 μCi kg−1 (n = 1/timepoint). Representative whole-body autoradioluminogram showing tissue distribution of radioactivity at Day 2 is shown. Red indicates intensity of radioactivity detected. d–e WT/C57BL6 (n = 3) or Pkd2-KO mice (n = 3) were dosed SC with PBS or 20 mg kg−1 of RGLS4326 on postnatal day (P)21, P22 and P23, and kidneys were harvested on P26. Kidney sections were co-stained with LTA (proximal tubules marker) or DBA (collecting ducts marker), anti-PS antibody (antibody labels RGLS4326) and DAPI. Representative merged immunofluorescence images of stained kidney sections demonstrating delivery of RGLS4326 to (d) proximal tubules and (e) collect duct cyst cells are shown. No glomerulus localization of RGLS4326 was observed in all mice tested. f Kidney target engagement-vs.-time profile of RGLS4326 showed kidney target engagement (blue diamond) peaked at 7 days, and continued through to at least 14 days, after a single 30 mg kg−1 SC dose in WT/C57BL6 mice (n = 5/group). g Dose-responsive target engagement of miR-17 in kidney tissues 7 days following a single SC dose of RGLS4326 at 0.003 (n = 4), 0.03 (n = 8), 0.1 (n = 4), 0.3 (n = 8), 3 (n = 4), 10 (n = 8), and 30 mg kg−1 (n = 10) in WT/C57BL6 mice. h–i RGLS4326 treatment dose-responsively engaged miR-17 in polycystic kidneys of two PKD mouse models 7 days after a single SC dose compare to PBS (closed black circle). RGLS4326 was dosed at 3, 30, and 100 mg kg−1 in JCK/C57BL6 mice (n = 5), and at 1, 3, 10, 30 mg kg−1 in Pcy/CD1 mice (n = 4). Control oligo (grey) was used as a negative control. Error bars represent standard deviations. Glomerulus, gl (dotted circle). Scale bars, 50 μm (except as specified in e, 2 mm). Source data for Fig. 4a–c and f–i is provided in Source data files

