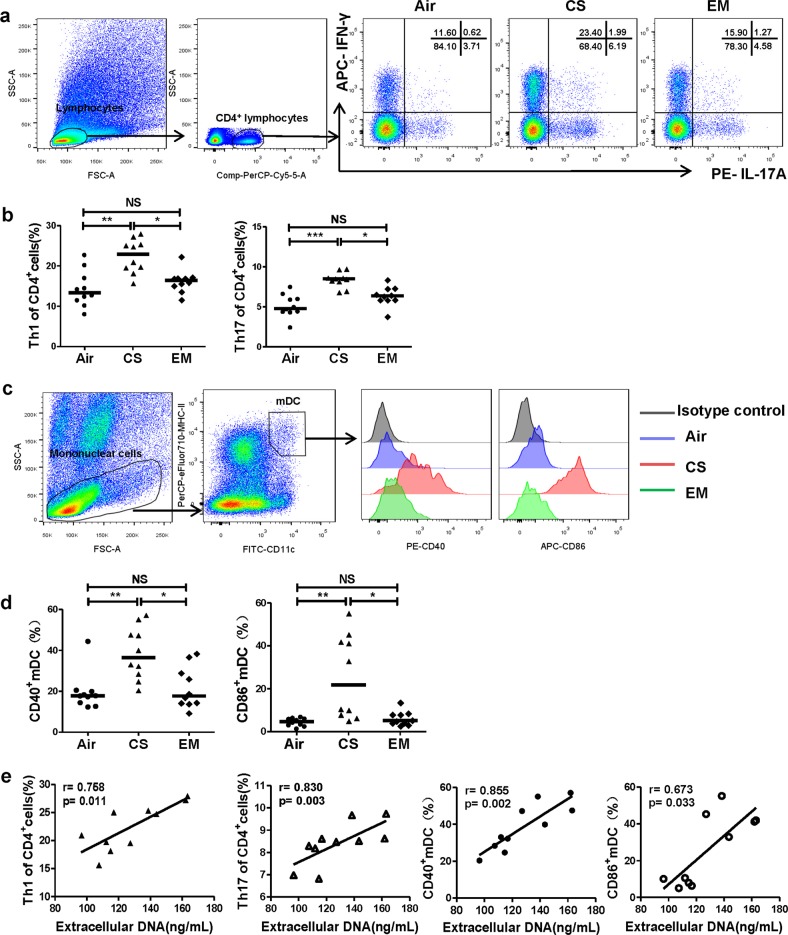
Fig. 9. Erythromycin suppresses Th1 and Th17 responses and activation of mDCs along with inhibition of NETs in mice.
a Lung single-cell suspensions were prepared freshly and detected Th1, Th17 and mDCs by flow cytometry. Lymphocytes of lungs were identified based on FSC and SSC. Th1 cells were identified by CD4+IFN-γ+ cells, and Th17 cells were identified by CD4+IL-17+ cells. Representative scatter plots of Th1 and Th17 cells of air controls (Air), cigarette smoke exposed mice (CS) and cigarette smoke exposed mice treated with erythromycin (EM) were shown. b The proportions of Th1 and Th17 cells in CD4+ cells in lungs of Air group, CS group and EM group. Data are expressed as medians (n = 10). The comparisons were determined by Kruskal–Wallis one-way ANOVA on ranks. *P < 0.05, **P < 0.01, ***P < 0.001, NS, not significant. c Mononuclear cells of lungs were identified based on FSC and SSC. The mDCs were identified by CD11c+MHC-IIhigh cells. Representative histograms of CD40 and CD86 of mDCs in lungs of Air group, CS group and EM group were shown. d The proportions of CD40+ mDCs and CD86+ mDCs in lungs of Air group, CS group and EM group. Data are expressed as medians (n = 10). The comparisons were determined by Kruskal–Wallis one-way ANOVA on ranks. *P < 0.05, **P < 0.01, NS, not significant. e The correlations between extracellular DNA in BALF of CS group and their Th1 cells, Th17 cells, CD40+ mDCs and CD86+ mDCs in lungs were determined by Spearman’s rank correlation coefficient

