Fig. 1.

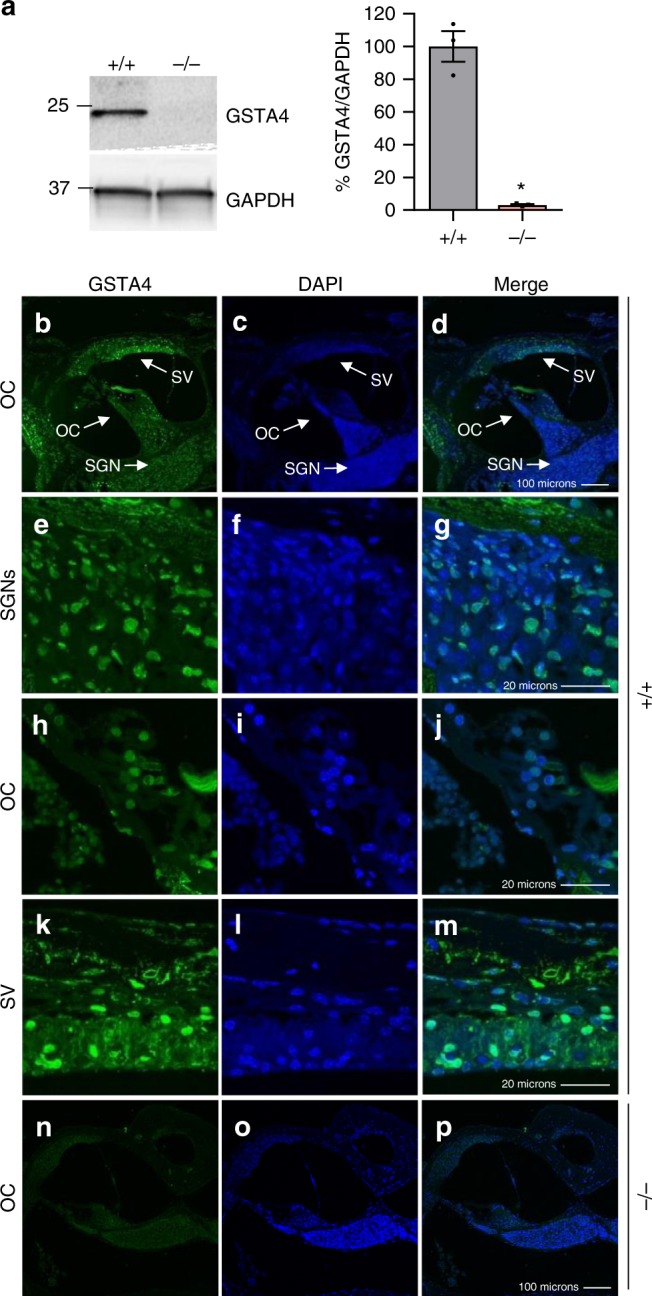
Localization of GSTA4 protein in mouse cochlea. a Western blot analysis of GSTA4 protein levels in the inner ear from young male Gsta4+/+ and Gsta4−/− mice. The full-length blot is presented in the Source Data file. n = 3, *p < 0.05 vs. +/+ (unpaired two-tailed Student’s t test). Error bars represent ± s.e.m. b–p GSTA4 staining (green; b, e, h, k, n), DAPI staining (blue; c, f, i, l, o), and merged staining (d, g, j, m, p) were detected in the organ of Corti regions (b–d, n–p), SGNs (e–g), organ of Corti (h–j), and SVs (k–m) from 3-month-old WT (b–m) and Gsta4−/− (n–p) males. OC organ of Corti. Scale bar = 100 μm (d, p) or 20 μm (g, j, m)
