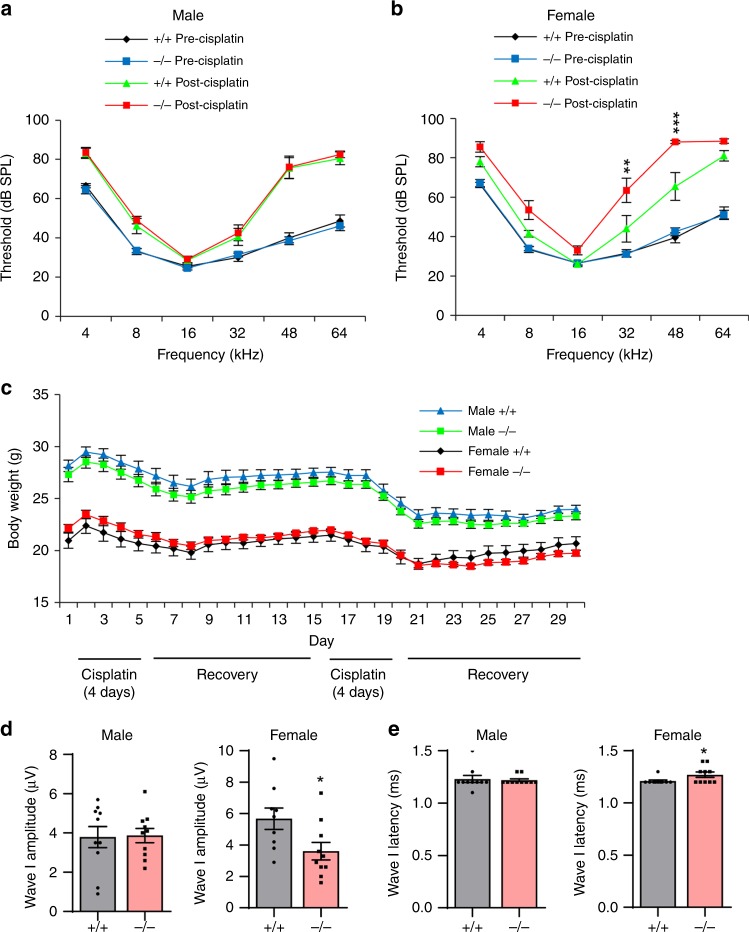
Fig. 2.
Assessment of ABR hearing thresholds, wave I amplitudes, and latencies. a, b ABR hearing thresholds were measured at 4, 8, 16, 32, 48, and 64 kHz in male (a) and female (b) Gsta4+/+ and Gsta4−/− mice. n = 10, *p < 0.05 vs. +/+ post-cisplatin (two-way ANOVA). Error bars represent ± s.e.m. c The body weight of male and female Gsta4+/+ and Gsta4−/− mice was measured during cisplatin treatment. n = 10. Error bars represent ± s.e.m. d, e ABR wave I amplitudes (d) and latencies (e) were measured in male and female Gsta4+/+ and Gsta4−/− mice. n = 10, *p < 0.05 vs. +/+ (unpaired two-tailed Student’s t test). Error bars represent ± s.e.m. Source data are provided as a Source Data file

