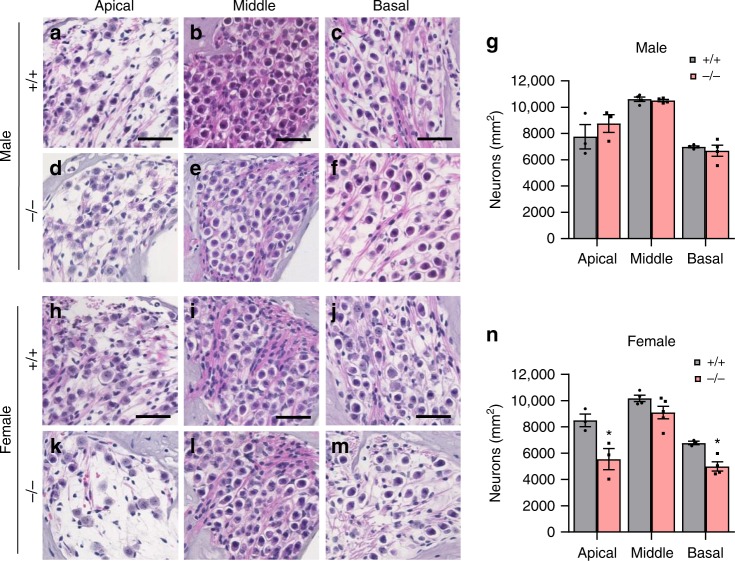
Fig. 3.
Assessment of SGN density. a–n SGN regions in the apical, middle, and basal regions of cochlear tissues from male (a–f) and female (h–m) Gsta4+/+ and Gsta4−/− mice after cisplatin treatment. Scale bar = 20 μm. SGN densities in the apical, middle, and basal regions of cochlear tissues from male (g) and female (n) Gsta4+/+ and Gsta4−/− mice were counted and quantified. The quantification shows a mean of at least three independent experiments (n = 3), *p < 0.05 vs. +/+ (two-way ANOVA). Error bars represent ± s.e.m. Source data are provided as a Source Data file

