Fig. 8.

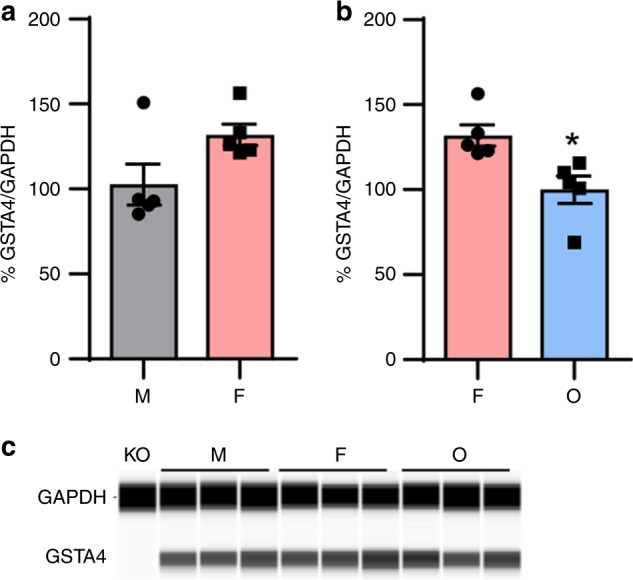
Assessment of GSTA4 protein levels in the inner ears of CBA/CaJ mice. a, c GSTA4 protein levels were measured in the inner ear tissues from male and female CBA/CaJ mice. n = 5. Error bars represent ± s.e.m. b, c GSTA4 protein levels were measured in the inner ear tissues from female and OVX CBA/CaJ mice. n = 5, *p < 0.05 vs. F (unpaired two-tailed Student t test). Error bars represent ± s.e.m. The relative protein levels were normalized to levels of GAPDH. The full-length blot is presented in the Source Data file. M: male, F: female, O: ovariectomized female. Source data are provided as a Source Data file
