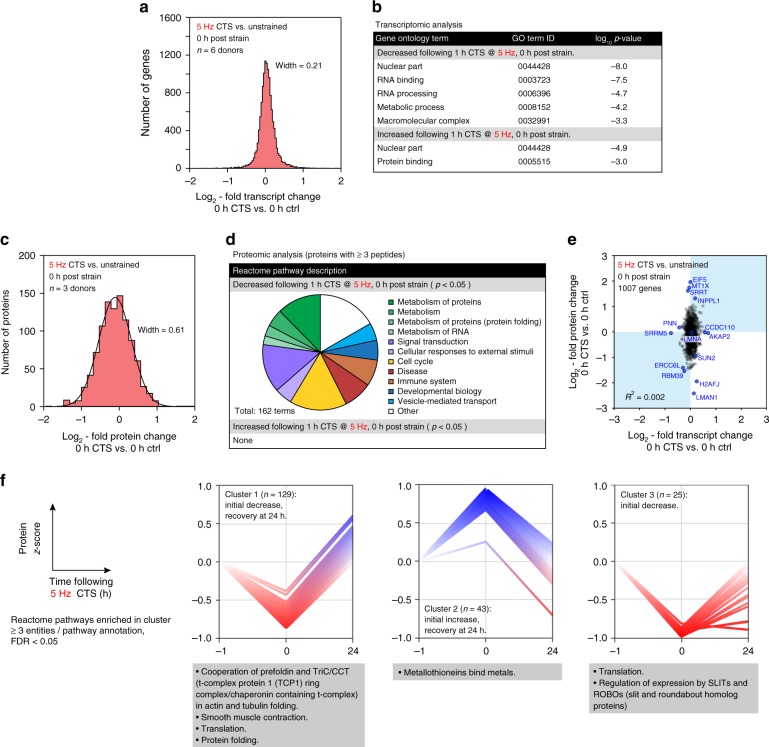
Fig. 2.
Changes to the proteome following CTS are uncorrelated to transcript. a Histogram of changes to mRNA in primary hMSCs immediately following high-intensity CTS (1 h at 5 Hz, 2.6–6.2 % strain; n = 6 donors); data displayed as log2-fold transcript change CTS versus unstrained controls. The width of a Gaussian curve fitted to the distribution was 0.21. There were no significant changes in SUN2. See Supplementary Data 1 and 2. b Gene ontology (GO) term analysis of the transcripts significantly affected by CTS. Annotations suggest nuclear remodeling (nuclear component terms are both up- and down-regulated), and down-regulation of RNA processing and metabolism. c Histogram of proteomic changes quantified by mass spectrometry (MS) immediately following CTS (1 h at 5 Hz, 2.6–6.2 % strain; n = 3 donors). Data displayed as log2-fold change following CTS, versus unstrained controls. Proteins quantified by ≥3 peptides. See Supplementary Fig. 4b for volcano plot and Supplementary Data 3 and 4. A Gaussian curve fit to the distribution had a width of 0.61 and maximum at −0.11 ± 0.01. d Analysis of Reactome pathways significantly affected at the protein level following CTS (p < 0.05; proteins quantified by ≥3 peptides; n = 3 donors). Proteins associated with cellular metabolic processes were decreased following strain, including protein and RNA associated metabolism. e Correlation plot between proteome and transcriptome immediately following CTS (1007 genes quantified by RNA-seq and in proteomics by ≥3 peptides; selected outlying genes/proteins of interest are annotated; R-squared = 0.002). The distribution of changes to protein levels was broader than, and uncorrelated with, transcript changes. Transcript and protein levels were partially recovered 24 h after CTS (Supplementary Fig. 4a, c–e). f K-means clustering was used to group quantified proteins based on their response to CTS after 0 and 24 h. Analysis showed four possible clusters to be most appropriate for this dataset (Supplementary Fig. 4f). Three clusters are shown annotated with significant Reactome enrichments; ≥3 proteins per annotation; false discovery rate (FDR) <0.05. p-values were calculated using empirical Bayes-modified t-tests with Benjamini–Hochberg correction

