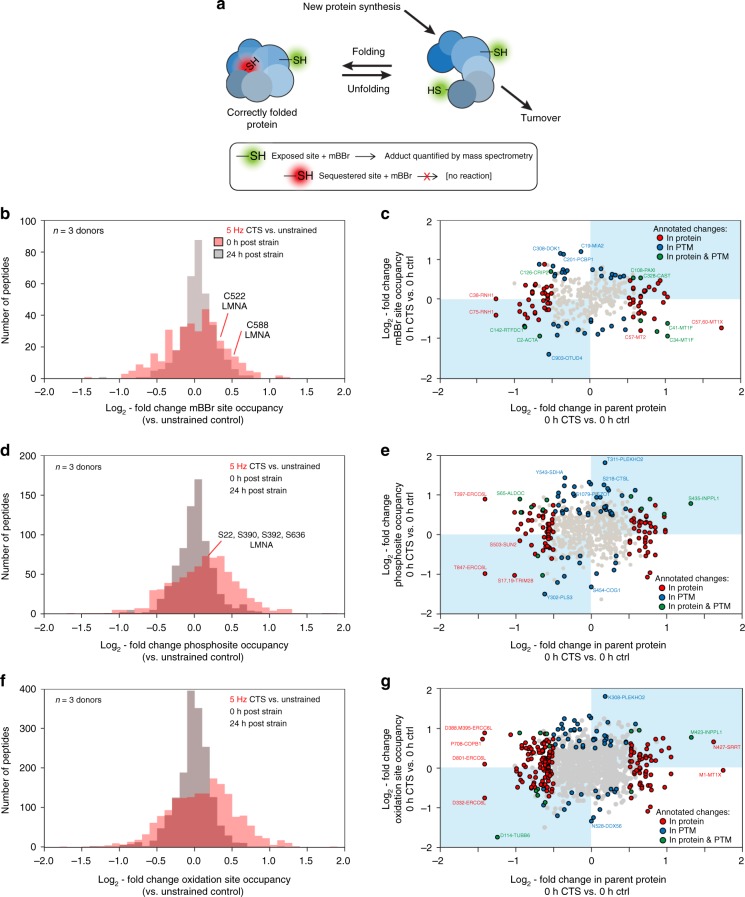
Fig. 3.
Post-translational modification (PTM) states respond to CTS. a Schematic diagram of differential labeling of sulfhydryl groups by monobromobimane (mBBr)1, 40. Exposed cysteine residues are rapidly labeled, but those sequestered within folded proteins are unreactive; changes to the extent of labeling are indicative of altered protein conformation in response to a stress condition. Changes in protein quantity are determined by rates of synthesis versus turnover. b Histogram showing log2-fold changes to mBBr labeling site occupancy immediately and 24 h after hMSCs were subjected to CTS (1 h at 5 Hz, 2.6–6.2 % strain; n = 3 donors), relative to unstrained controls. The distribution immediately following CTS was broad and displaced to the right. After 24 h, the distribution was narrowed and centered around zero. Annotations indicate two sites within LMNA with significantly increased modification (p < 0.05). c Correlation between changes to mBBr labeling site occupancy and the quantity of the parent protein (i.e. source of the labeled peptide), immediately following CTS. d Histogram showing changes to phosphosite occupancy immediately and 24 h after CTS (1 h at 5 Hz, 2.6–6.2% strain; n = 3 donors), relative to unstrained controls. All phosphorylation sites shown have been curated previously in the PhosphoSitePlus database70. The distribution was shifted to the right immediately following CTS. e Correlation between phosphorylation and protein quantity. f Histogram showing changes to oxidation-site occupancy immediately and 24 h after CTS (1 h at 5 Hz, 2.6–6.2 % strain; n = 3 donors), relative to unstrained controls. g Correlation between oxidation and protein quantity; in 33% of cases, increased oxidation correlated with decreased protein levels (points in the top left quadrant). In c, e, and g, data points are annotated as indicated in the legend if |log2-fold change| > 0.5 and p < 0.05, otherwise they are shown in gray; labels indicate modified sites within proteins. p-values were calculated using empirical Bayes-modified t-tests with Benjamini–Hochberg correction. See Supplementary Data 3–7

