Fig. 1.
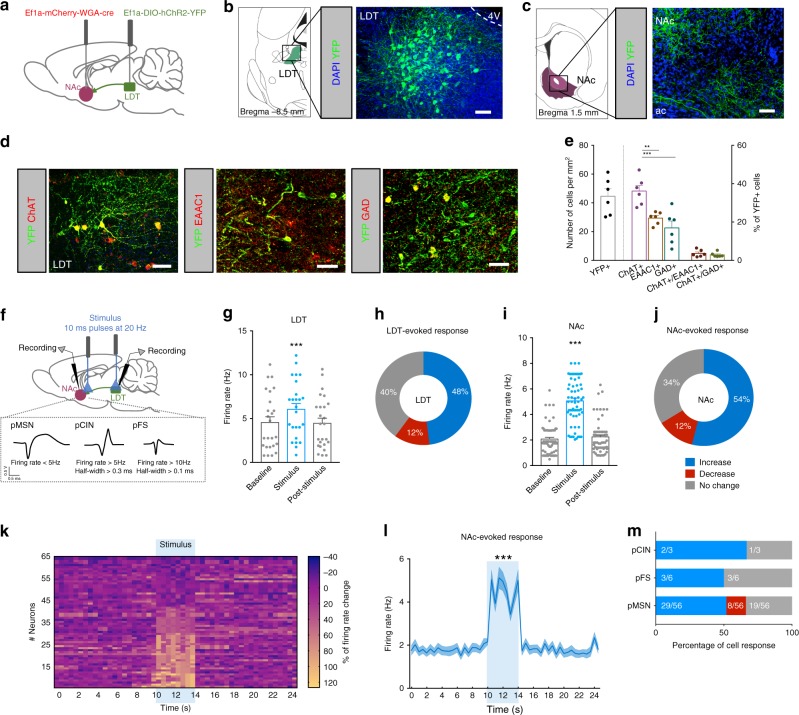
LDT stimulation drives a predominantly excitatory response in the NAc. a Strategy used for LDT-NAc optogenetic manipulation. b Representative immunofluorescence showing YFP staining in the LDT and c in terminals in the NAc; scale bar = 100 μm. d Representative immunofluorescence for eYFP (green) and ChAT, EAAC1 or GAD65/67 (red); scale bar = 50 μm. e Respective quantification of double and triple positive cells, indicative of transfected neurons (n = 6 animals, 1way ANOVA). f Electrophysiological strategy for cell recording in the LDT and in the NAc. NAc neurons were separated into pMSNs, pCINs, and pFS. g LDT neurons increase firing rate in response to optical activation of LDT cell bodies (80 pulses of 10ms at 20 Hz) (n = 5 animals; 25 LDT cells; 1way ANOVA). h 48% of LDT recorded cells increase their firing rate during stimulation. i NAc cells increase firing rate in response to LDT optical stimulation (n = 9 animals; 65 cells; 1way ANOVA). j Around half of recorded cells in the NAc show an increase in the firing rate upon stimulation, 34% present no change and 12% decrease activity. k Heatmap representation of percentage of cell responses in the NAc when LDT terminals are stimulated. Each row represents a neuron. l Average distribution of the firing rate of NAc neurons showing an increase in activity during stimulation period (KS test). m 52% of recorded pMSNs increase their activity (29/56 cells), 34% did not change firing rate (19/56 cells) and 14% decrease their activity (8/56 cells); 67% pCINs (2/3 cells) and 50% pFS (3/6 cells) interneurons increase and 33% pCINs (1/3 cells) and 50% pFS (3/6 cells) interneurons do not change their activity. Values are shown as mean ± s.e.m. **p < 0.01, ***p < 0.001. ac- anterior commissure; 4V: 4th ventricle

