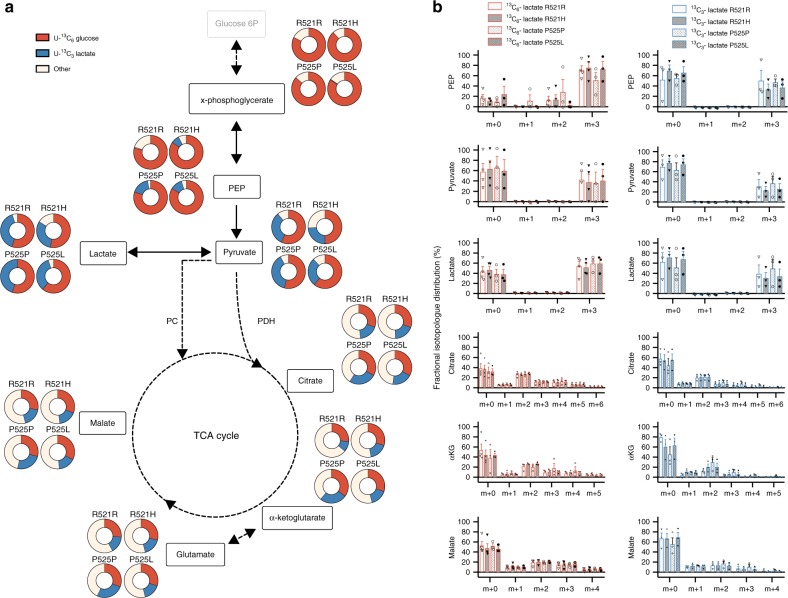
Fig. 5.
Metabolic fate of glucose and lactate in MNs derived from FUS–ALS patients and isogenic controls. a Fractional contribution of uniformly labelled 13C glucose (red) and uniformly labelled 13C lactate (blue) to metabolites from glycolysis and TCA cycle in patient (R521H or P525L) and isogenic control (R521R or P525P) motor neurons. b Relative abundance of each isotopologue for specific metabolites in patient and isogenic control motor neurons. The data represent mean ± s.e.m. from three independent experiments, with individual data points shown. Two-way ANOVA analysis with Tukey post hoc test was used to compare FUS-patients and isogenic controls, but did not show differences (p > 0.05). Dark grey bars indicate FUS-patient cell lines. Light grey bars indicate isogenic controls from these patients. Bar fill patterns show the corresponding patient and isogenic control. Thin black arrows represent direct metabolic pathway connections; dashed arrows indicate that additional intermediate reactions are involved in a metabolic pathway. Source data are provided as a source data file. 13C6-glucose uniformly labelled glucose, 13C3-lactate uniformly labelled lactate, PEP phosphoenolpyruvate, PC pyruvate carboxylase, PDH pyruvate dehydrogenase, αKG alpha-ketoglutarate, TCA tricarboxylic acid

