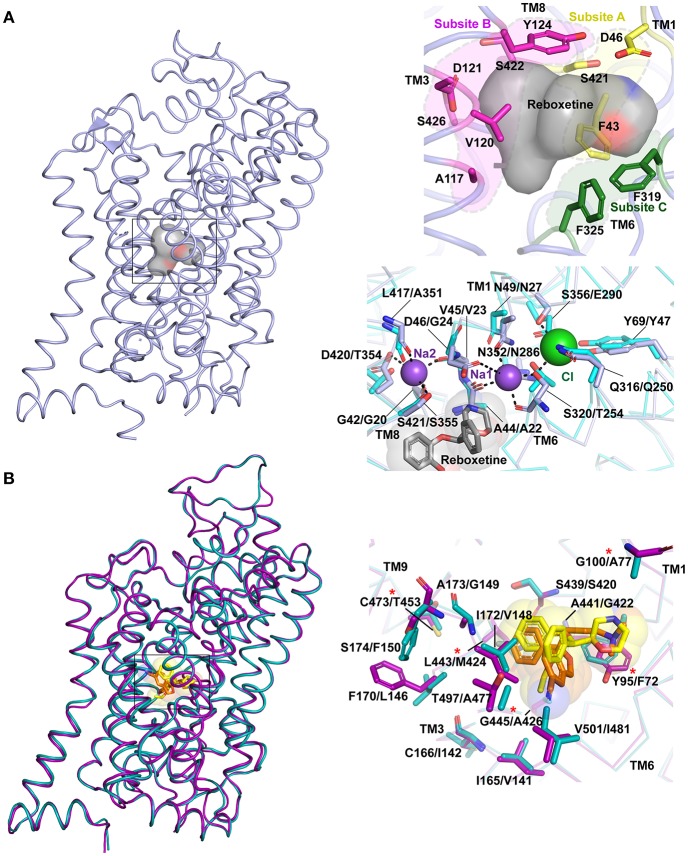
Figure 6.
(A) Primary binding site in neurotransmitter transporters are subdivided into subsites A (yellow), B (magenta) and C (green). The surface of the bound drug molecule is displayed in gray. Residues involved in the ion binding sites are compared within dDAT (light blue) bound to reboxetine, represented by gray sphere (PDB ID: 4XNX) and LeuT (cyan) (PDB ID: 3F3A). The first residue in description represents dDAT followed by its equivalent in LeuT. (B) Differences in binding pockets of hSERT (magenta) bound to S-citalopram (orange) (PDB ID: 5I73) overlapped with dDAT bound to reboxetine (yellow) (PDB ID: 4XNX) and hNET homology model (cyan). The first residue in description represents hSERT followed by its equivalent in hNET. Asterisk represents five hSERT like substitutions in hNET that increase the affinity of hNET toward S-citalopram (Andersen et al., 2011).

