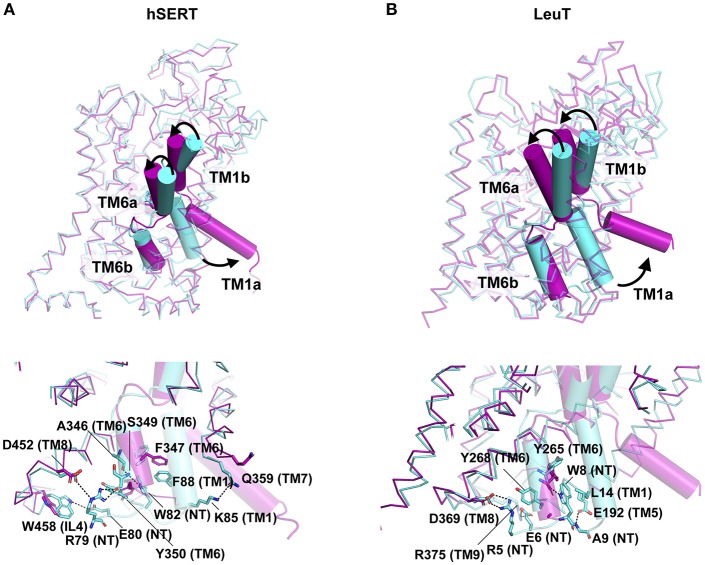
Figure 8.
(A,B) Extracellular and Cytosolic gating of the substrate in hSERT (PDB ID: 6DZV, 6DZZ) and LeuT (PDB ID: 3TT1, 3TT3) respectively. Oo state of the structure is represented in cyan whilst Io state in magenta. Structures display the difference in the conformation as a consequence of TM1b, TM6a closing on the top and TM1a open to release neurotransmitter into the intracellular milieu. Intracellular network of H-bonds and hydrophobic interactions represented in the bottom panel for each molecule.

