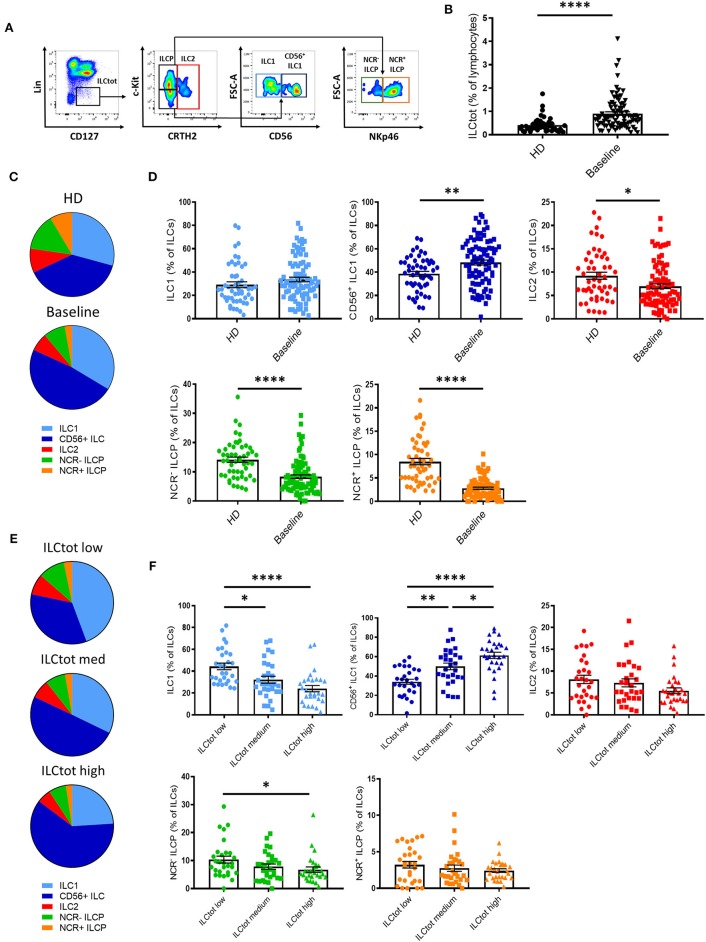
Figure 2.
Distribution of ILCs in healthy donors and in metastatic colorectal cancer patients. (A) Flow cytometry gating strategy for ILC subset identifications in PBMCs. (B) Frequencies of ILCtot. ILC subset distributions (C) and frequencies (D) were analyzed by flow cytometry in PBMCs of 51 healthy donors (HD) and 86 chemotherapy-naïve metastatic colorectal cancer patients (baseline). Distribution (E) and frequencies (F) of ILC subsets based on the frequency of ILCtot distributed in the low (n = 29), medium (n = 29), and high (n = 28) terciles. Columns, the means of ILC frequency for each patient; bars, SEM. *p < 0.05, **p < 0.005, ****p < 0.0001, as determined by Student's t-test or ANOVA.

