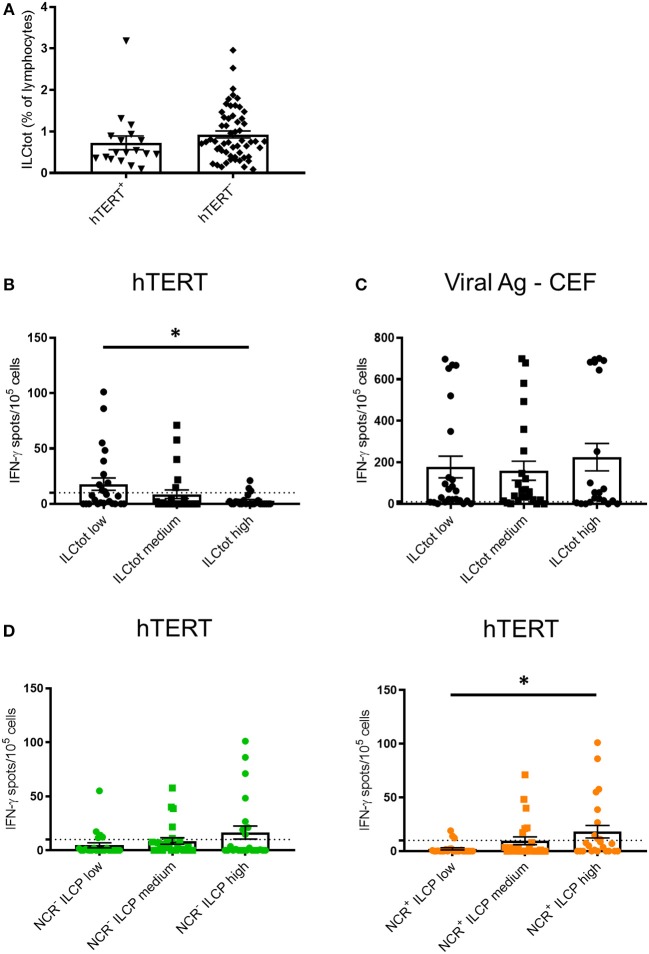
Figure 3.
IFN-γ ELISpot hTERT responses relative to the distribution of ILCs. PBMCs from 74 chemotherapy-naïve metastatic colorectal cancer patients were cultured with a mixture of 8 hTERT peptides (TERT44−58, TERT578−592, TERT921−935, TERT1055−1069, TERT541−555, TERT573−587, TERT613−627, and TERT911−925) at 5 μg/mL. The T cell reactivity against the hTERT peptides was detected by IFN-γ ELISpot assays, as described in the Material and Methods. Stimulation with Viral Ag-CEF peptides was used as control for T cell reactivity. (A) The frequency of ILCtot in the PBMCs of each patient was analyzed based on the positive (n = 18) or negative (n = 56) response to hTERT. (B,C) Results are shown as the means of IFN-γ spot numbers (magnitude) and the ILC frequencies (ILCtot distributed into low (n = 25), medium (n = 25) and high (n = 24) terciles) for hTERT responses (B) and Viral Ag-CEF responses (C). (D) Results are shown as the means of IFN-γ spot numbers (magnitude) and frequencies of NCR− ILCP (left) and NCR+ ILCP (right) distributed among the low (n = 25), medium (n = 25) and high (n = 24) terciles. Columns, the means of spots from triplicate wells; bars, SEM. *p < 0.05, as determined by Student's t-test.

