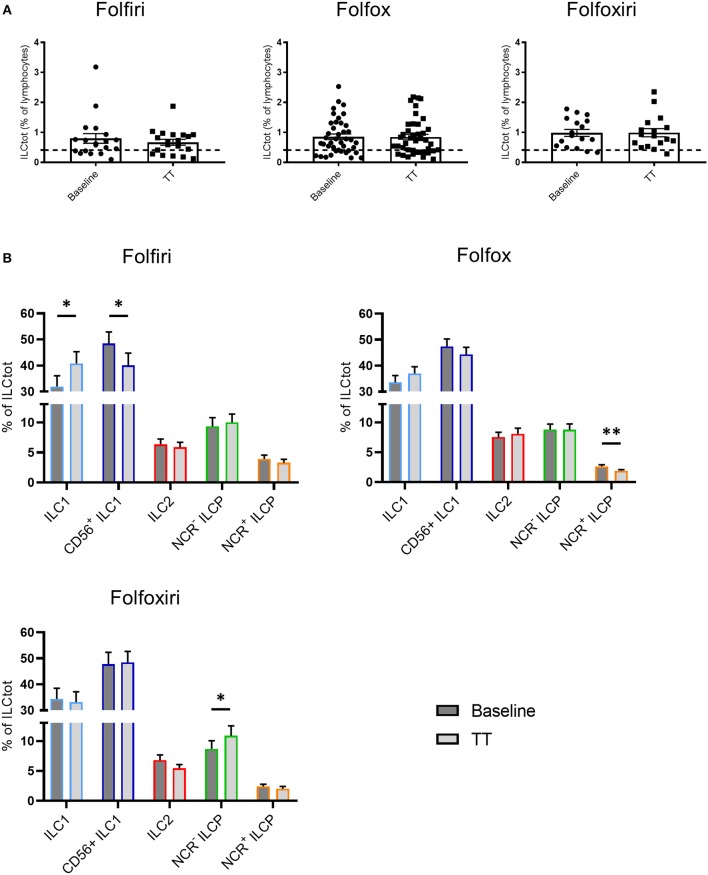
Figure 4.
Effect of chemotherapy treatments on ILC distribution. Frequencies of ILCtot (A) and ILC subsets (B) were analyzed by flow cytometry in PBMCs from chemotherapy-naïve mCRC patients (baseline) and after 3 months of treatment (TT). The mean frequency of ILCtot for HD is represented by a dashed line. Each patient received either the 5FU/Irinotecan regimen (Folfiri) (baseline/TT matched patients, n = 19), the 5FU/Oxaliplatin regimen (Folfox) (baseline/TT matched patients, n = 40), or the 5FU/Oxaliplatin/Irinotecan regimen (Folfoxiri) (baseline/TT matched patients n = 17). *p < 0.05, **p < 0.005, as determined by Student's t-test.

