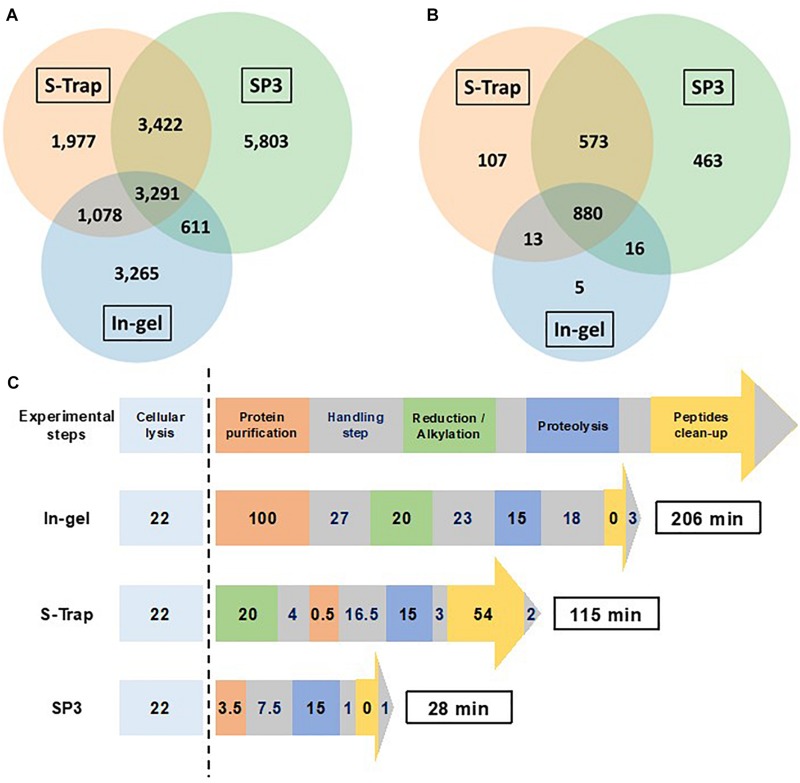
FIGURE 7.
Comparison of in-gel (Gel_15 min), S-Trap (S-Trap_15 min) and SP3 (SP3_15 min) optimized protocols. (A) Venn diagram showing the overlap of peptide sequences identified for each sample preparation methods. (B) Venn diagram showing the overlap of proteins validated with at least two different peptides for each sample preparation methods. (C) Schematic representation of the workflow timing for the three sample preparation methods (numbers indicated the time in min required per step).

